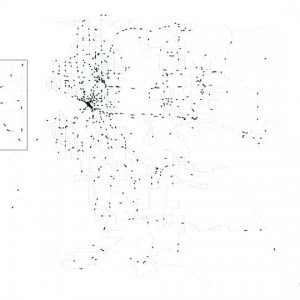
This animation shows 24 hours of Metro activity, over 200 bus routes on more than 12,000 trips. In this animation every bus is on time. Each bus is represented by a black dot that moves between stops. The bus positions are computed every 6 seconds of real time, though the bus routes are approximated as straight lines between stops (faint grey dots).
I created this visualization of Metro activity to show how integral the bus system is to daily life in Seattle. Simply mapping the bus stops traces every major street and boundary in the city. The Metro system provides over 115,400,000 passenger trips per year.
View this complete post...
Tags: James Davenport, King County, Seattle, Video, Vimeo, WA, Washington
Posted in
Local, Public Transportation, Show Us Your Infra, Transit, Urban Planning
Comments Off on King County, WA: 24 Hours of King County Metro


 RSS Feed