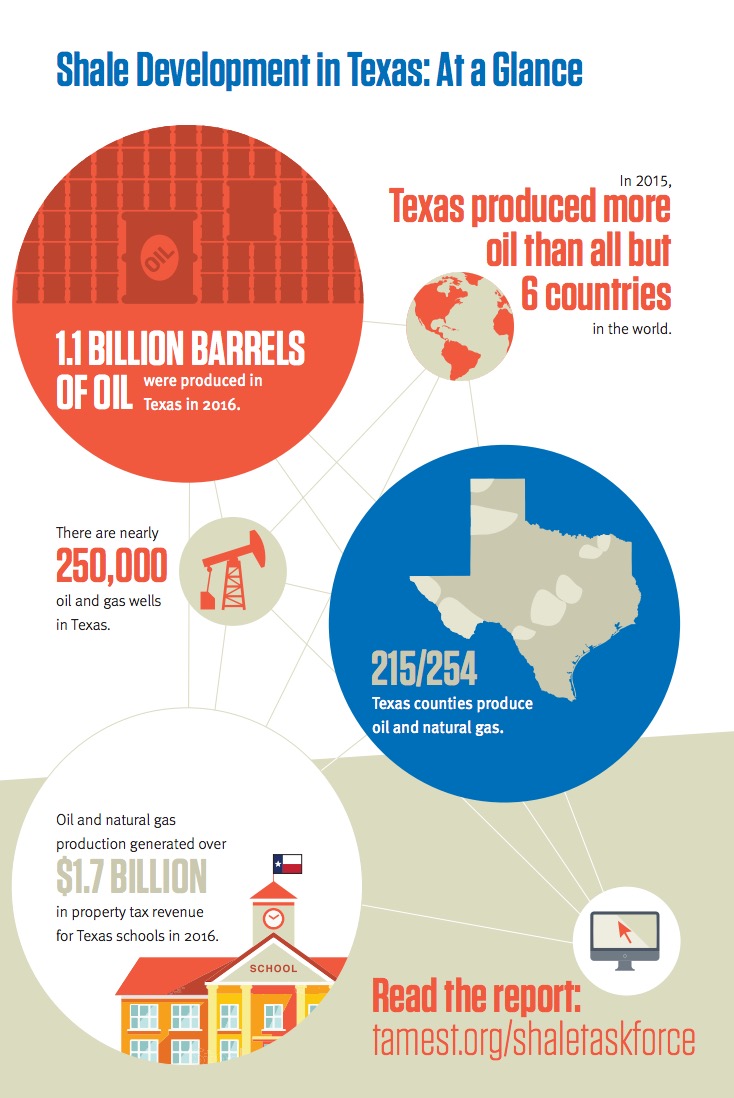
The Academy of Medicine, Engineering and Science of Texas (TAMEST) convened a task force to prepare this report on the Texas shale development experience. This report covers the underlying science for six topic areas as it pertains to shale exploration and production activities: 1) geology and earthquake activity; 2) land resources; 3) air quality; 4) water quantity and quality; 5) transportation; and 6) economic and social impacts.
View this complete post...Posts Tagged ‘Petroleum’
Environmental and Community Impacts of Shale Development in Texas
Tuesday, July 18th, 2017A National Strategy for Energy Security: The Innovation Revolution
Tuesday, May 24th, 2016SECURING AMERICA’S ENERGY FUTURE
ENERGY SECURITY LEADERSHIP COUNCIL
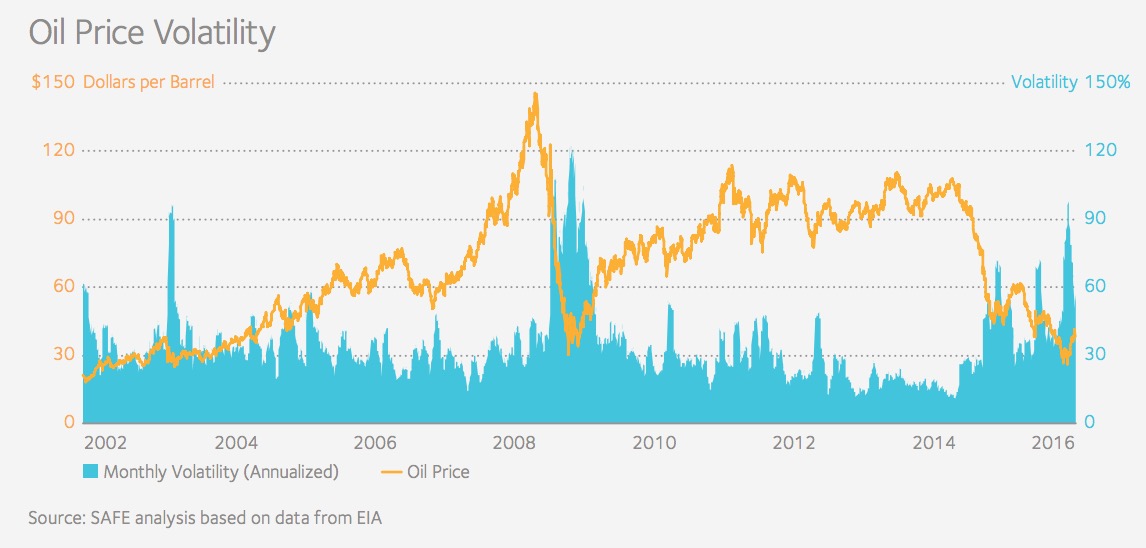
Too often, America’s exposure to the risks of oil dependence has been measured by consumers and
policymakers as a function of the price of oil at a specific point in time or our level of reliance on foreign
suppliers. The result has been long periods of inaction and inattention after each crisis, which simply
leaves the country dangerously exposed for the inevitable next crisis. The risk of such complacence
today is high. Low oil prices have reduced the sense of urgency shared throughout the country as
recently as 2014. Yet just as it has been so many times before, the oil market is in the midst of a cycle.
We must be better prepared when the tide once again turns.
Oil Market Futures
Friday, April 22nd, 2016CAMBRIDGE ECONOMETRICS
THE INTERNATIONAL COUNCIL FOR CLEAN TRANSPORTATION
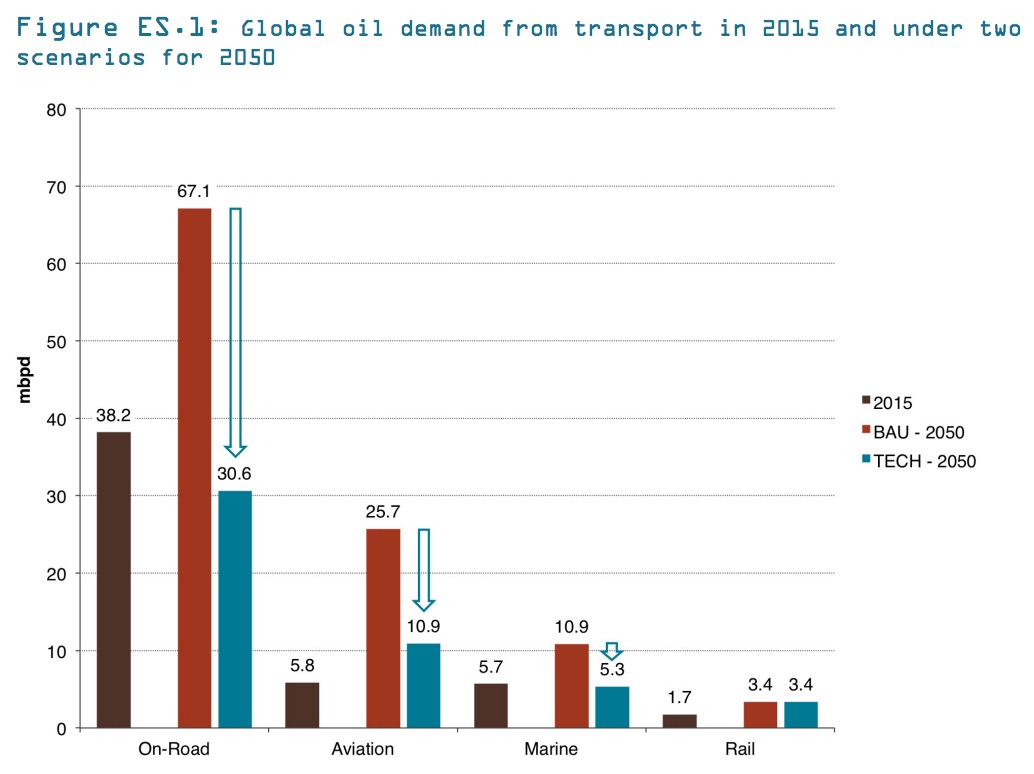
Policies to tackle climate change are likely to lead to lower oil prices, according to the results of this analysis. As governments start implementing the Paris Agreement, they will increasingly need to cut carbon emissions from transport by curbing the combustion of petroleum fuels. Lower oil prices will prevail in this lower-demand scenario, compared to a business-as-usual scenario where oil demand would rise unchecked and in line with economic growth and expanding mobility trends.
Transportation Fuels Supply & Demand on the West Coast
Friday, October 2nd, 2015UNITED STATES ENERGY INFORMATION ADMINISTRATION
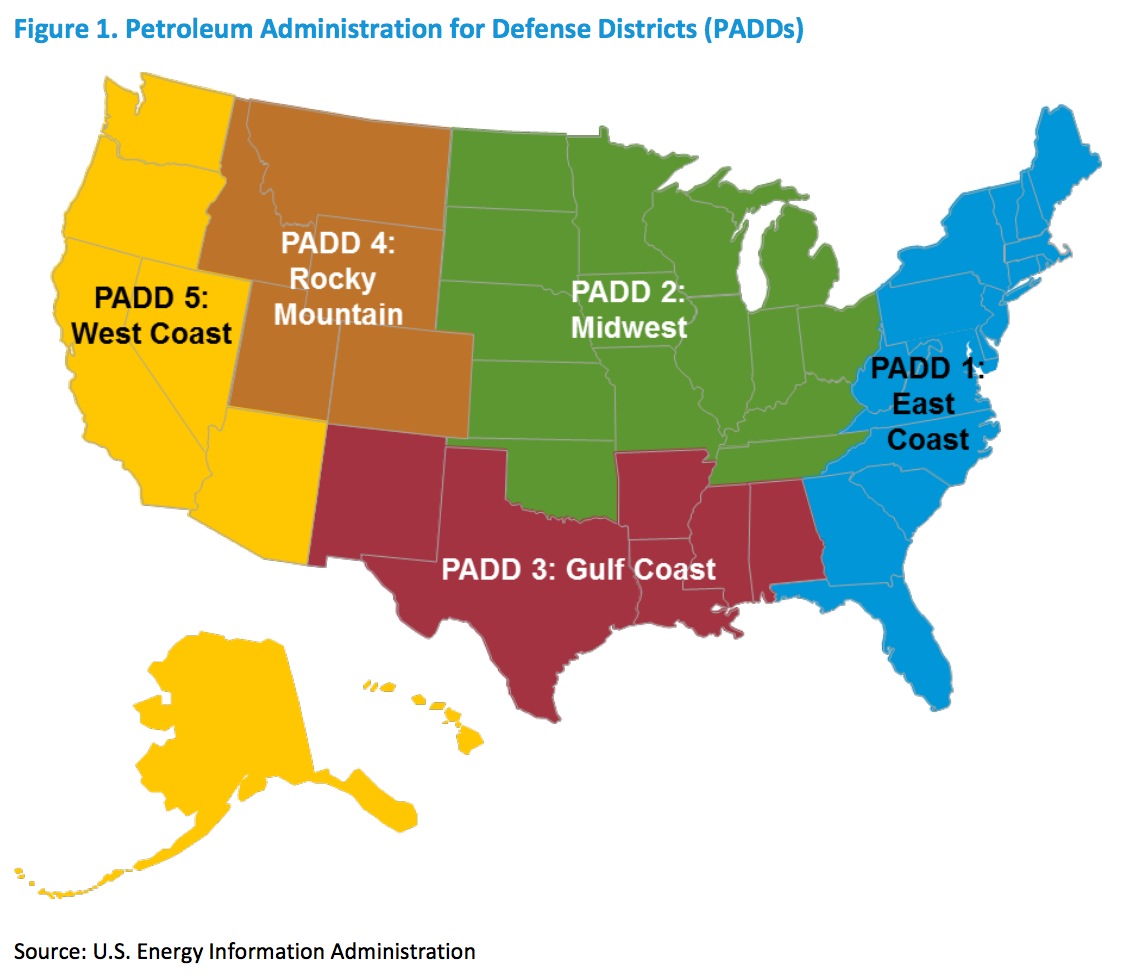
This study examines supply, demand, and distribution of transportation fuels in Petroleum Administration for Defense District (PADD) 5, a region that includes the western states of California, Arizona, Nevada, Oregon, Washington, Alaska, and Hawaii. For this study, transportation fuels include gasoline, diesel fuel, and jet fuel.
Our Energy Tomorrow: The State of American Energy
Friday, January 9th, 2015America now occupies a position of energy leadership that was unthinkable a short time ago. Gone are the days of uncertainty and concern over having the supply of energy we need, when we need it. Today, the United States is the world’s top producer of natural gas, the world’s leading refiner of petroleum products, and very soon could be the leading producer of oil…But this is only part of America’s larger energy story. The United States is in the midst of a new era in domestic energy abundance characterized by rising use of renewable energy and increased oil and natural gas production that is strengthening our economic outlook and enabling America to emerge as a global energy superpower.
View this complete post...EPA Program to Protect Underground Drinking Water Needs Improvement
Wednesday, August 6th, 2014UNITED STATES GOVERNMENT ACCOUNTABILITY OFFICE
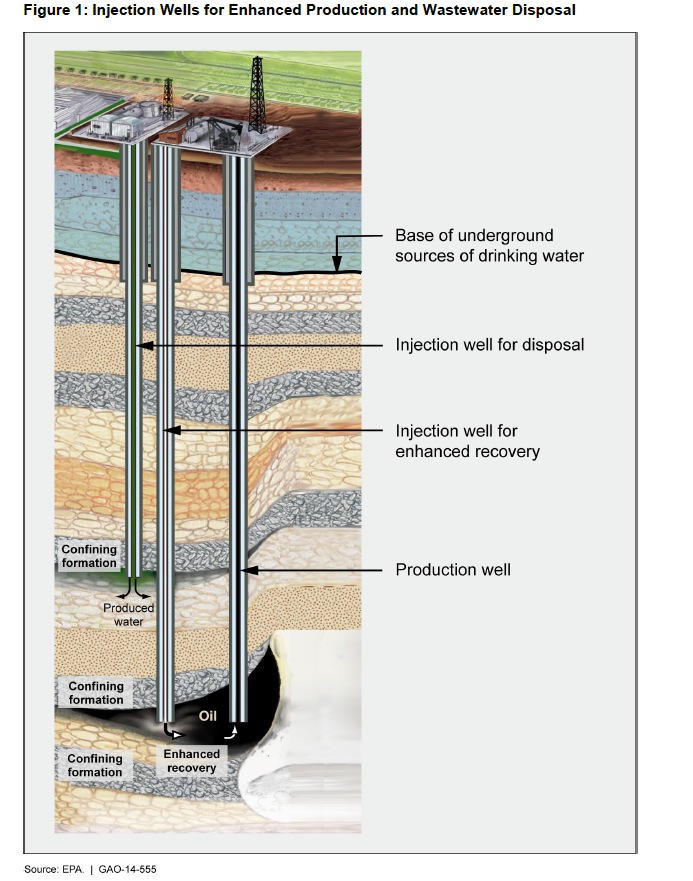
Every day in the United States, at least 2 billion gallons of fluids are injected into over 172,000 wells to enhance oil and gas production, or to dispose of fluids brought to the surface during the extraction of oil and gas resources. These wells are subject to regulation to protect drinking water sources under EPA’s UIC class II program and approved state class II programs. Because much of the population relies on underground sources for drinking water, these wells have raised concerns about the safety of the nation’s drinking water.
U.S. Crude Oil and Natural Gas Production in Federal and Non-Federal Areas
Friday, April 18th, 2014CONGRESSIONAL RESEARCH SERVICE
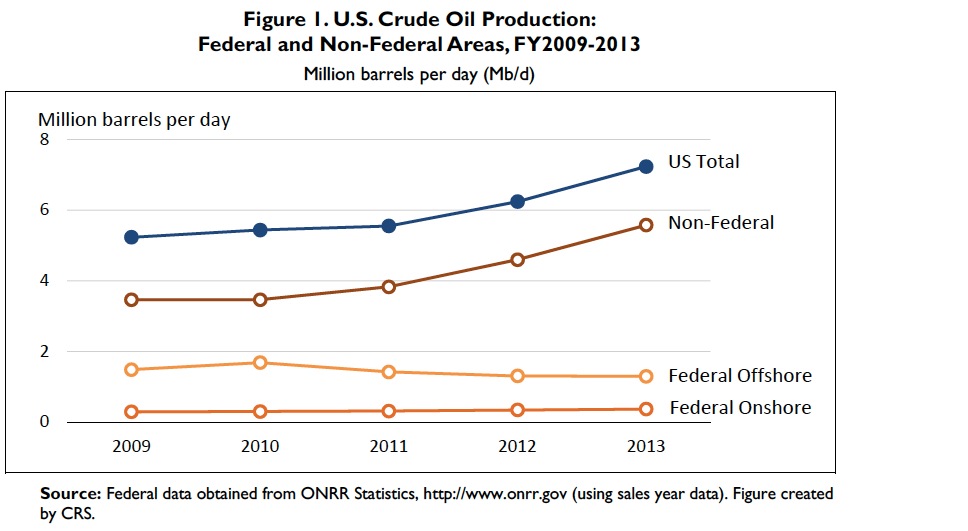
A key question in this discussion is how much oil and gas is produced in the United States each year and how much of that comes from federal versus non-federal areas. Oil production has fluctuated on federal lands over the past five fiscal years but has increased dramatically on nonfederal lands. Non-federal crude oil production has been rapidly increasing in the past few years partly due to favorable geology and the relative ease of leasing from private parties, rising by 2.1 million barrels per day (mbd) between FY2009-FY2013, causing the federal share of total U.S. crude oil production to fall by nearly 11%.
Future of Fuels
Wednesday, April 16th, 2014NATIONAL ASSOCIATION FOR CONVENIENCE AND FUEL RETAILING
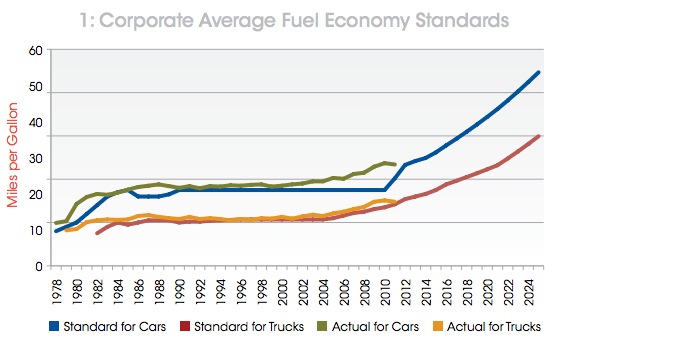
In December 2013, the U .S . Energy Information Administration (EIA) released the early publication of its Annual Energy Outlook 2014 (AEO2014), providing projections for the energy markets through 2040 . NACS used EIA’s report to prepare the following analysis. “Future of Fuels 2014” seeks to determine how EIA’s projections will directly affect the retail fuels market, consumer use of specific types of light duty vehicles, and the pace at which alternative fuels may gain market share.
The Electric Slide: Where America’s Energy Goes
Tuesday, April 15th, 2014AMERICAN TRAINCO
Although we might consider electricity a primary source of energy in our lives since we use it for a variety of household items, electricity is actually a secondary source. Electricity is generated from primary energy sources like coal, natural gas, petroleum, and renewable energy sources like wood, biofuels, wind, and hydropower.
Oil & Natural Gas Transportation & Storage Infrastructure: Status, Trends, & Economic Benefits
Wednesday, January 8th, 2014AMERICAN PETROLEUM INSTITUTE
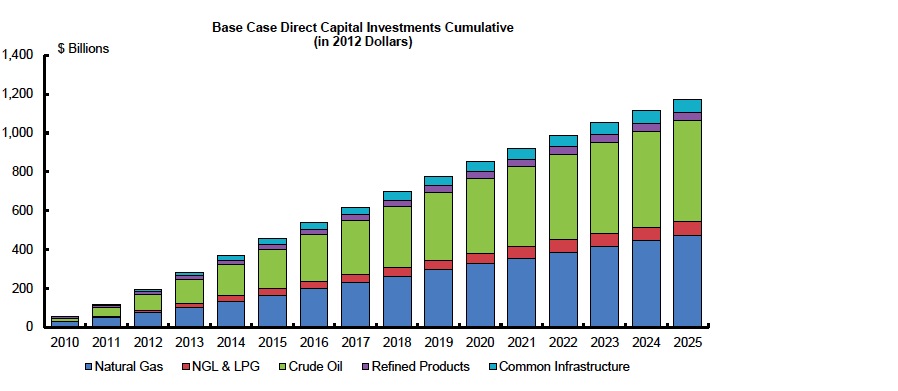
Over the past five years, unconventional oil and gas activity has thrust the nation into an unexpected position. The U.S. is now the global growth leader in crude oil production capacity growth, adding nearly 1.2 million barrels per day (mbd) of capacity over the 2008 – 2012 time period. In addition, the U.S. is now the largest natural gas producer, at 65 billion cubic feet (Bcf) per day. At the same time, unconventional activity is spurring the growth of natural gas liquids (NGLs) production, adding over 500,000 barrels of oil equivalent (boe) per day since 2008. This has brought the total increase in liquids production capacity to some 1.7 mbd since 2008.
Follow InfrastructureUSA
CATEGORIES
- Accountability (219)
- Aging Infrastructure (753)
- Aviation (130)
- Biking (323)
- Bipartisan (271)
- Bridges (493)
- Broadband (57)
- Buses (160)
- Carbon Tax (22)
- Clean Air (182)
- Climate Change (200)
- Competitiveness (230)
- Congestion (327)
- Dams (77)
- Democrat (123)
- Drinking Water (191)
- Economic Stimulus (276)
- Employment (207)
- Energy (585)
- Environment (615)
- Equity (239)
- Funding (887)
- Global (205)
- Great American Infrastructure (33)
- Green (294)
- Guests on The Infra Blog (275)
- Hazardous Waste (27)
- High Speed Rail (224)
- Highway (785)
- Inland Waterways (204)
- Jobs (251)
- Land Use (98)
- LEED (28)
- Levees (42)
- Local (1,910)
- National (1,525)
- Policy (1,121)
- Pollution (215)
- Private Investment (213)
- Public Opinion (189)
- Public Parks & Recreation (196)
- Public Transportation (1,028)
- Racism (6)
- Rail (502)
- Recession (65)
- Recovery (218)
- Republican (109)
- Roads (1,120)
- Schools (80)
- Seaports (68)
- Smart Grid (98)
- Smart Growth (442)
- Solid Waste (26)
- Sustainability (765)
- Tax (112)
- Technology (397)
- Telecommunications (46)
- Transit (1,333)
- Urban Planning (980)
- Wastewater (180)
- Water Treatment (165)
Video, stills and tales. Share images of the Infra in your community that demands attention. Post your ideas about national Infra issues. Go ahead. Show Us Your Infra! Upload and instantly share your message.
Is the administration moving fast enough on Infra issues? Are Americans prepared to pay more taxes for repairs? Should job creation be the guiding determination? Vote now!
What do the experts think? This is where the nation's public policy organizations, trade associations and think tanks weigh in with analysis on Infra issues. Tell them what you think. Ask questions. Share a different view.
The Infra Blog offers cutting edge perspective on a broad spectrum of Infra topics. Frequent updates and provocative posts highlight hot button topics -- essential ingredients of a national Infra dialogue.
Dear Friends,
It is encouraging to finally see clear signs of federal action to support a comprehensive US infrastructure investment plan.
Now more than ever, our advocacy is needed to keep stakeholders informed and connected, and to hold politicians to their promises to finally fix our nation’s ailing infrastructure.
We have already engaged nearly 280,000 users, and hoping to add many more as interest continues to grow.
We require your support in order to rise to this occasion, to make the most of this opportunity. Please consider making a tax-deductible donation to InfrastructureUSA.org.
Steve Anderson
Managing Director
SteveAnderson@InfrastructureUSA.org
917-940-7125