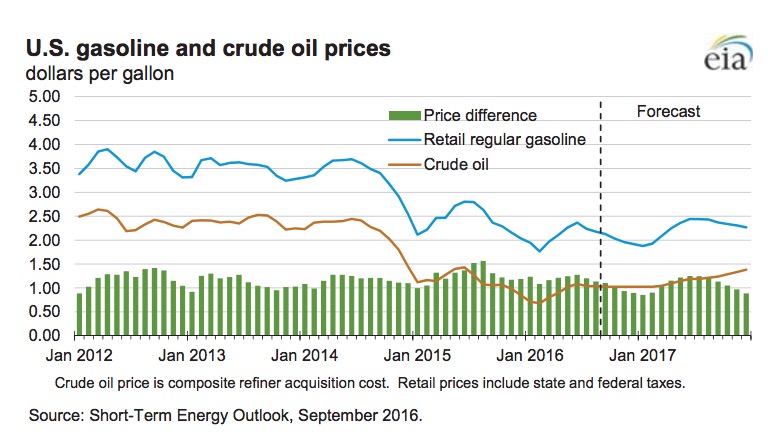
Global consumption of petroleum and other liquid fuels is estimated to have grown by 1.4 million b/d in 2015. EIA expects global consumption to increase by 1.5 million b/d in 2016 and by 1.4 million b/d in 2017, mostly driven by growth in countries outside of the Organization for Economic Cooperation and Development (OECD). Non-OECD consumption growth was 0.9 million b/d in 2015, and it is expected to be 1.2 million b/d in 2016 and 1.3 million b/d in 2017.
View this complete post...Posts Tagged ‘Coal’
EIA Short-Term Energy Outlook
Tuesday, September 13th, 2016Drinking Water & Fracking: Risk Assessment
Wednesday, June 10th, 2015UNITED STATES ENVIRONMENTAL PROTECTION AGENCY
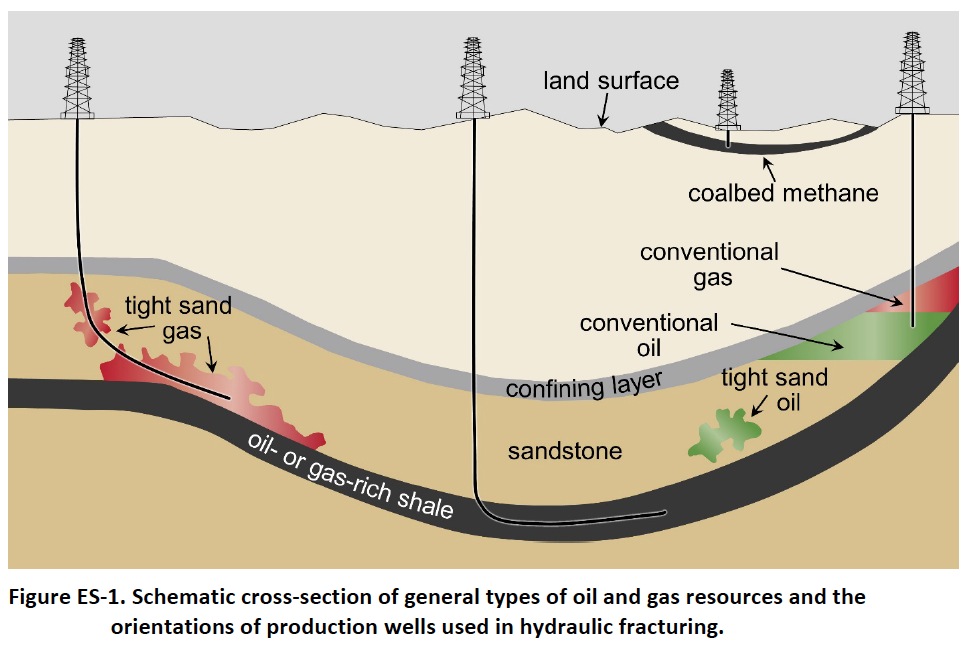
From our assessment, we conclude there are above and below ground mechanisms by which hydraulic fracturing activities have the potential to impact drinking water resources. These mechanisms include water withdrawals in times of, or in areas with, low water availability; spills of hydraulic fracturing fluids and produced water; fracturing directly into underground drinking water resources; below ground migration of liquids and gases; and inadequate treatment and discharge of wastewater.
De-carbonizing U.S. Power
Monday, April 20th, 2015BLOOMBERG NEW ENERGY FINANCE
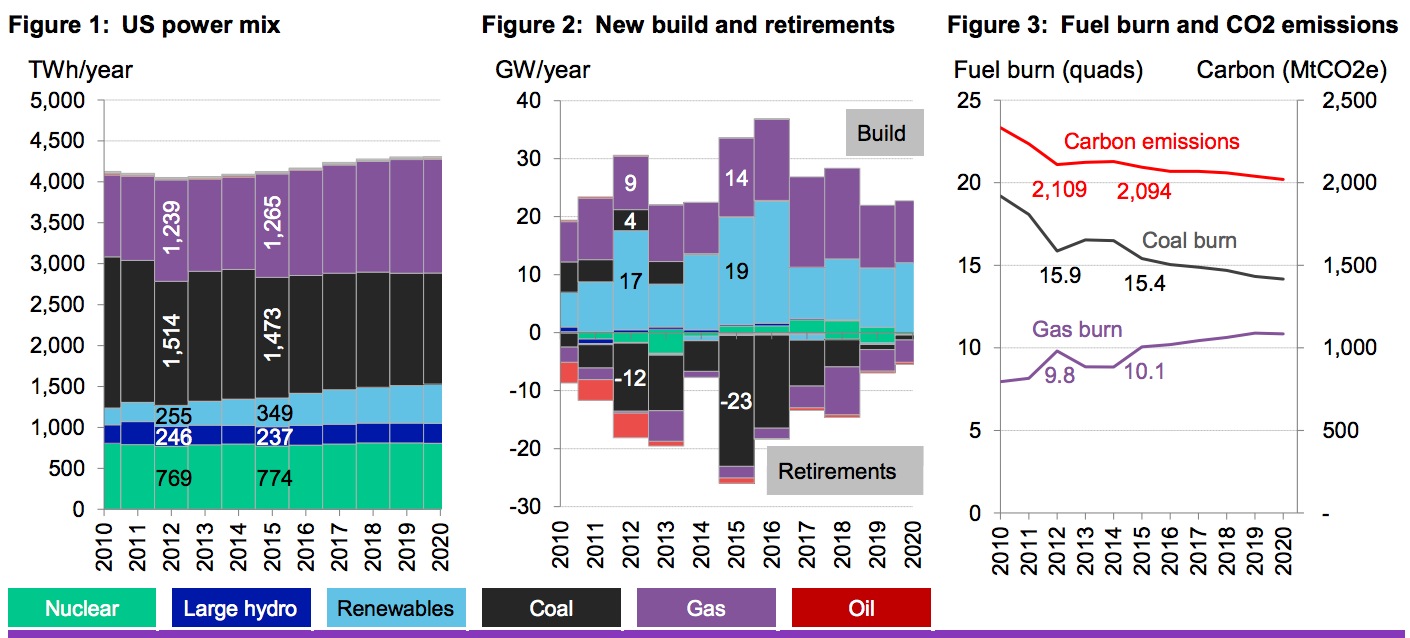
In 2015, the US could set new national records: for annual renewable build; for coal retirements; and for gas burn from the power sector. Meanwhile, electricity-related emissions could fall to their lowest levels since 1994. This Research Note examines our short-term forecasts for US power.
U.S. Homeowners on Clean Energy: A National Survey
Monday, April 13th, 2015CLEAN EDGE
SOLARCITY
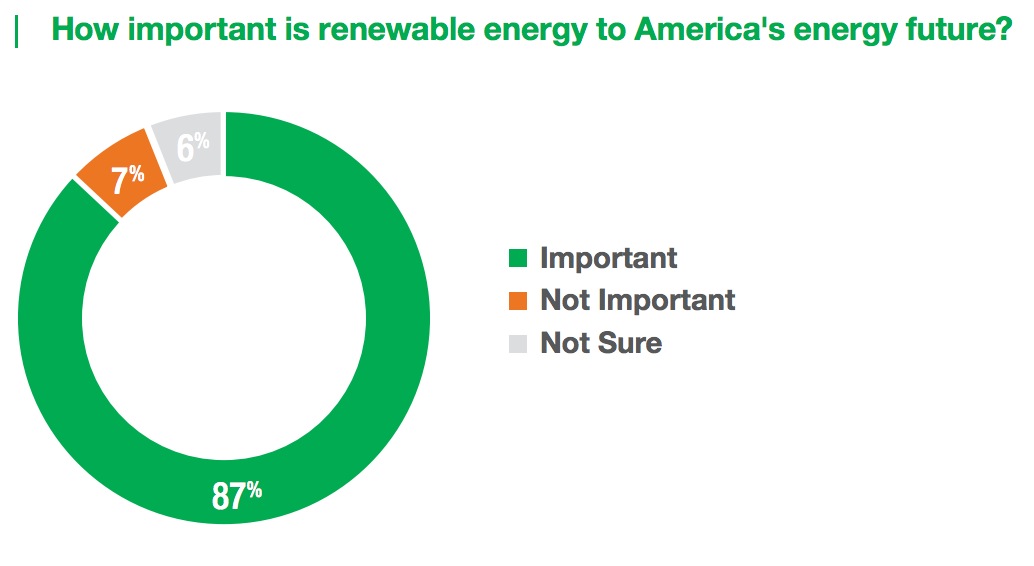
In our second annual survey of U.S. homeowner purchasing trends and attitudes, we find that clean-energy products and services – including solar PV, utility-scale renewables, hybrid electric vehicles, and green buildings – continue to experience double-digit compound annual growth rates (CAGRs). Sustained double-digit growth rates for more than a decade reflect the long-term nature of this current shift to more efficient, cleaner, and environmentally friendly products and services. But don’t be mistaken; as our research clearly points out, it is cost savings, much more than environmental factors, that are driving this monumental shift.
Washington State: The Impact of the Growing Coal & Oil Industry
Monday, April 6th, 2015Up to three times a day trains carrying up to three million gallons of Bakken crude oil from North Dakota travel through the Northwest, quite literally under downtown Seattle and along the Puget Sound en route to oil refineries in Anacortes and Cherry Point. With big potential markets in Asia and a booming coal and oil industry in Wyoming and North Dakota in search of ports to export, the Northwest is poised to experience major growth in fossil fuel industries.
View this complete post...Our Energy Tomorrow: The State of American Energy
Friday, January 9th, 2015America now occupies a position of energy leadership that was unthinkable a short time ago. Gone are the days of uncertainty and concern over having the supply of energy we need, when we need it. Today, the United States is the world’s top producer of natural gas, the world’s leading refiner of petroleum products, and very soon could be the leading producer of oil…But this is only part of America’s larger energy story. The United States is in the midst of a new era in domestic energy abundance characterized by rising use of renewable energy and increased oil and natural gas production that is strengthening our economic outlook and enabling America to emerge as a global energy superpower.
View this complete post...Toxic Trash Exposed: Coal Ash in Michigan
Friday, November 8th, 2013CLEAN WATER FUND
Water defines, and is central, to Michigan’s economy. Major tourism, agriculture, and fishing industries depend on the health of rivers, lakes, and streams. The Great Lakes contain over 20% of the world’s usable fresh surface water. Unfortunately unmitigated coal ash pollution is a major threat to the health of the state’s water and economy.
The Social Cost of Carbon
Thursday, September 26th, 2013ASSOCIATION FOR ENVIRONMENTAL STUDIES AND SCIENCES
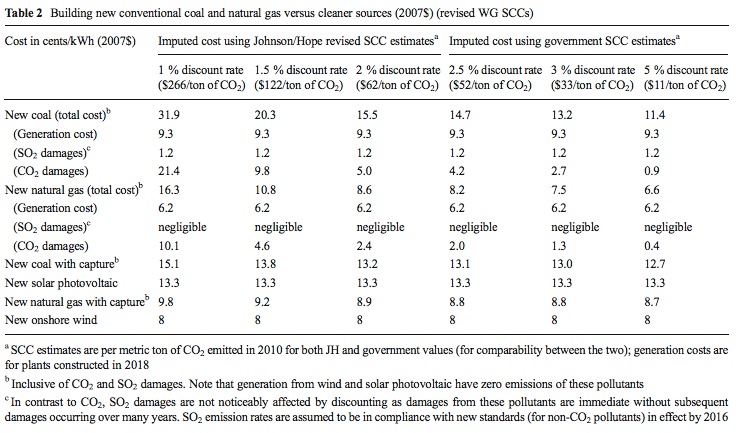
This paper extends the work of Johnson and Hope (2012), who re-estimated the US government’s estimates of climate change damages, called the “social cost of carbon” (SCC), to more fully account for impacts on future generations. To demonstrate the policy implications of their SCC estimates, Johnson and Hope (JH) incorporated the costs of pollution into the cost of electricity generation from coal, natural gas, onshore wind, and solar photovoltaic…Overall, for new generation, we find that all JH and government SCCs justified conventional natural gas, natural gas with CCS, and wind over conventional coal. Most estimates also justified solar and coal with CCS over conventional coal, and wind over natural gas. For existing generation, at all of JH’s SCCs, continuing to operate some of the dirtiest coal plants is more expensive than replacing them with natural gas, natural gas with CCS, or wind; at their two highest estimates, this is also true for new coal with CCS and solar photovoltaic.
New Dynamics of the U.S. Natural Gas Market
Tuesday, May 21st, 2013BIPARTISAN POLICY CENTER
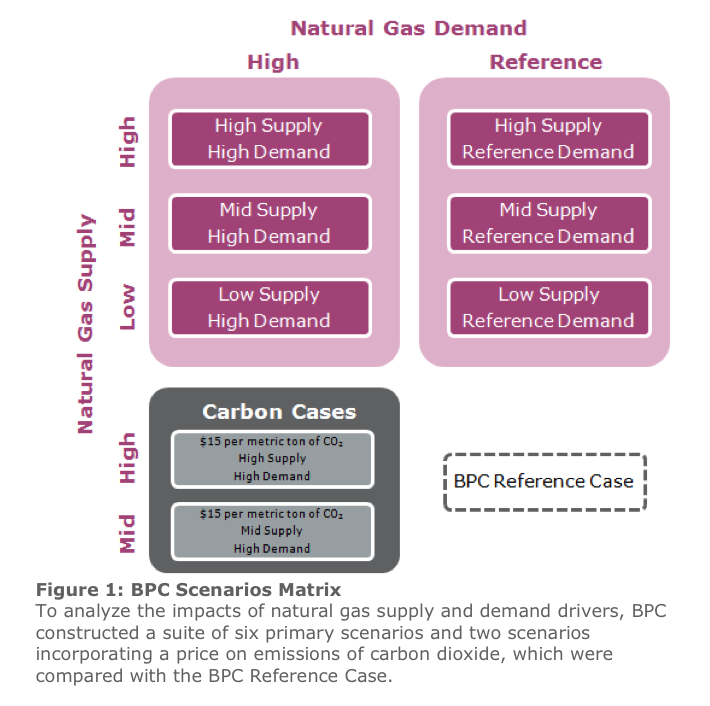
Natural gas is one of America’s most important energy resources. Comparatively clean burning and less carbon intensive than oil or coal, it is used as a fuel in a wide variety of applications throughout the economy. Rapid technological advancements in horizontal drilling and hydraulic fracturing have unlocked a large volume of gas resources in North American shale gas formations.
Infographic: How Much Fuel Does it Take to Power a Lightbulb for a Year?
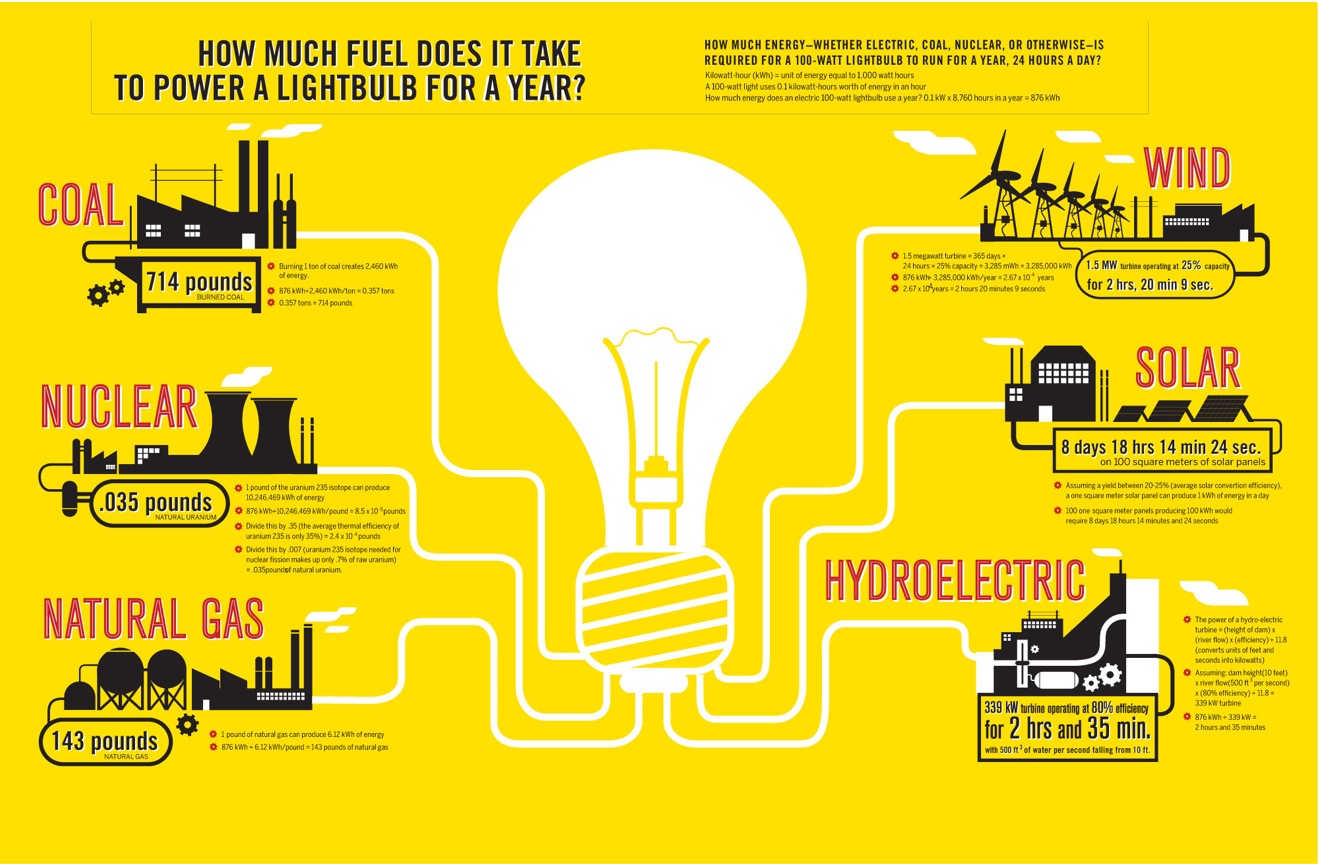
Tuesday, January 10th, 2012GOOD.IS View full infographic (GOOD.is): How Much Fuel Does it Take to Power a Lightbulb for a Year? About GOOD.is www.good.is “We are people, businesses, moms, kids, artists, organizations, policymakers, students, teachers, and engineers. All united in one simple idea, each elevated by being connected. Let’s do what works and never default to what doesn’t. […]
View this complete post...Follow InfrastructureUSA
CATEGORIES
- Accountability (219)
- Aging Infrastructure (751)
- Aviation (130)
- Biking (323)
- Bipartisan (271)
- Bridges (493)
- Broadband (57)
- Buses (160)
- Carbon Tax (22)
- Clean Air (182)
- Climate Change (200)
- Competitiveness (230)
- Congestion (327)
- Dams (77)
- Democrat (123)
- Drinking Water (191)
- Economic Stimulus (276)
- Employment (207)
- Energy (585)
- Environment (615)
- Equity (239)
- Funding (886)
- Global (205)
- Great American Infrastructure (33)
- Green (294)
- Guests on The Infra Blog (271)
- Hazardous Waste (27)
- High Speed Rail (224)
- Highway (785)
- Inland Waterways (204)
- Jobs (251)
- Land Use (98)
- LEED (28)
- Levees (42)
- Local (1,910)
- National (1,525)
- Policy (1,121)
- Pollution (215)
- Private Investment (213)
- Public Opinion (189)
- Public Parks & Recreation (195)
- Public Transportation (1,027)
- Racism (6)
- Rail (501)
- Recession (65)
- Recovery (218)
- Republican (109)
- Roads (1,118)
- Schools (79)
- Seaports (68)
- Smart Grid (98)
- Smart Growth (442)
- Solid Waste (26)
- Sustainability (765)
- Tax (112)
- Technology (396)
- Telecommunications (46)
- Transit (1,332)
- Urban Planning (979)
- Wastewater (180)
- Water Treatment (165)
Video, stills and tales. Share images of the Infra in your community that demands attention. Post your ideas about national Infra issues. Go ahead. Show Us Your Infra! Upload and instantly share your message.
Is the administration moving fast enough on Infra issues? Are Americans prepared to pay more taxes for repairs? Should job creation be the guiding determination? Vote now!
What do the experts think? This is where the nation's public policy organizations, trade associations and think tanks weigh in with analysis on Infra issues. Tell them what you think. Ask questions. Share a different view.
The Infra Blog offers cutting edge perspective on a broad spectrum of Infra topics. Frequent updates and provocative posts highlight hot button topics -- essential ingredients of a national Infra dialogue.
Dear Friends,
It is encouraging to finally see clear signs of federal action to support a comprehensive US infrastructure investment plan.
Now more than ever, our advocacy is needed to keep stakeholders informed and connected, and to hold politicians to their promises to finally fix our nation’s ailing infrastructure.
We have already engaged nearly 280,000 users, and hoping to add many more as interest continues to grow.
We require your support in order to rise to this occasion, to make the most of this opportunity. Please consider making a tax-deductible donation to InfrastructureUSA.org.
Steve Anderson
Managing Director
SteveAnderson@InfrastructureUSA.org
917-940-7125