


ENERGY INFORMATION ADMINISTRATION (EIA)
Highlights
- Benchmark North Sea Brent crude oil spot prices averaged $46/barrel (b) in August, a $1/b increase from July. This was the fourth consecutive month in which Brent spot crude oil prices averaged between $44/b and $49/b.
- Brent crude oil prices are forecast to average $43/b in 2016 and $52/b in 2017. West Texas Intermediate (WTI) crude oil prices are forecast to average $1/b less than Brent in 2016 and 2017. The current values of futures and options contracts suggest high uncertainty in the price outlook. For example, EIA’s forecast for the average WTI price in December 2016 of $44/b should be considered in the context of Nymex contract values for December 2016 delivery. Contracts traded during the five-day period ending September 1 (Market Prices and Uncertainty Report) suggest the market expects WTI prices could range from $34/b to $65/b (at the 95% confidence interval) in December 2016.
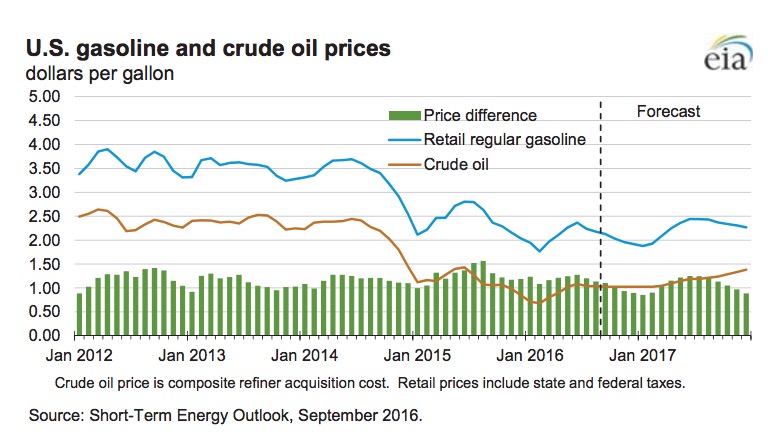
- U.S. regular gasoline retail prices are expected to decline from an average of $2.18/gallon (gal) in August to $1.92/gal in December. For the year, U.S. regular gasoline retail prices are forecast to average $2.08/gal in 2016 and $2.26/gal in 2017.
- U.S. crude oil production averaged 9.4 million barrels per day (b/d) in 2015. Production is forecast to average 8.8 million b/d in 2016 and 8.5 million b/d in 2017. Production levels in 2017 for this forecast are 0.2 million b/d higher than in the August STEO. The upward revisions to production largely reflect an assumption of higher drilling activity, rig efficiency, and well-level productivity than assumed in previous forecasts.
- Natural gas working inventories were 3,401 billion cubic feet (Bcf) on August 26. This level is 8% higher than last year during the same week, and 11% higher than the previous five-year (2011–15) average for that week. EIA projects that natural gas inventories will be 4,042 Bcf at the end of October 2016, which would be the highest end-of-October level on record.
 Global Petroleum and Other Liquid Fuels
EIA estimates that global petroleum and other liquid fuels inventory builds averaged 1.8 million b/d in 2015. The pace of inventory builds is expected to slow to an average of 0.8 million b/d in 2016. Inventory builds are expected to continue into early 2017, and then consistent inventory draws are forecast to begin in June 2017.
Global Petroleum and Other Liquid Fuels Consumption. Global consumption of petroleum and other liquid fuels is estimated to have grown by 1.4 million b/d in 2015. EIA expects global consumption to increase by 1.5 million b/d in 2016 and by 1.4 million b/d in 2017, mostly driven by growth in countries outside of the Organization for Economic Cooperation and Development (OECD). Non-OECD consumption growth was 0.9 million b/d in 2015, and it is expected to be 1.2 million b/d in 2016 and 1.3 million b/d in 2017.
India and China are expected to be the largest contributors to non-OECD petroleum consumption growth, with each country’s consumption forecast to increase between 0.3 million and 0.4 million b/d annually in both 2016 and 2017. In India, consumption growth is mainly a result of increased use of transportation fuels and of naphtha for new petrochemical projects. China’s growth in consumption of petroleum and other liquid fuels is driven by increased use of gasoline, jet fuel, and hydrocarbon gas liquids (HGL), which more than offsets decreases in diesel consumption. Last year’s significant rise in the use of HGL in China will continue through the forecast period, as new propane dehydrogenation (PDH) plants increase the use of propane.
OECD petroleum and other liquid fuels consumption rose by 0.5 million b/d in 2015. OECD consumption is expected to increase by 0.2 million b/d in 2016 and by 0.1 million b/d in 2017.
Non‐OPEC Petroleum and Other Liquid Fuels Supply. EIA estimates that petroleum and other liquid fuels production in countries outside the Organization of the Petroleum Exporting Countries (OPEC) grew by 1.5 million b/d in 2015, with more than half of the growth occurring in North America. However, EIA expects non-OPEC production to decline by 0.4 million b/d in 2016 and by 0.2 million b/d in 2017.
Changes in non-OPEC production are significantly affected by changes in U.S. tight oil production, which has high decline rates for production and relatively short investment horizons, making it among the most price-sensitive oil-producing areas. Forecast total U.S. production of liquid fuels declines by 290,000 b/d in 2016 and remains flat in 2017, as declining onshore crude oil production is partially offset by expected growth in HGL production, Gulf of Mexico crude oil production, and liquid biofuels production. Outside the United States, nonOPEC production declines by 120,000 b/d in 2016 and by 220,000 b/d in 2017.
Among non-OPEC producers outside the United States, the largest decline in 2016 is forecast to be in China. EIA expects China’s output to fall by 190,000 b/d in 2016 and by an additional 70,000 b/d in 2017 because of continued investment cuts and fewer new offshore developments. In 2017, the largest non-OPEC declines are in the North Sea and in Russia, which are forecast to decline by 210,000 b/d and 220,000 b/d, respectively, following forecast production growth in both areas this year.
Canadian production is expected to grow in both 2016 and 2017, although annual growth in 2016 will be only 30,000 b/d because of production lost to wildfires in Alberta that resulted in oil sands outages in May and June, and to a lesser extent in July. However, Canadian production is expected to increase by 250,000 b/d in 2017.
Non-OPEC unplanned supply outages in August were about 0.4 million b/d, a decrease of about 0.1 million b/d from the July level.
Download full version (PDF): Short-Term Energy Outlook
About the Energy Information Administration (EIA)
www.eia.gov
The U.S. Energy Information Administration (EIA) collects, analyzes, and disseminates independent and impartial energy information to promote sound policymaking, efficient markets, and public understanding of energy and its interaction with the economy and the environment.
Tags: Coal, EIA, Emissions, Energy Information Administration, Natural Gas, OPEC
 RSS Feed