PORTLAND BUREAU OF TRANSPORTATION
Introduction
Each year since the early 1990s, the Portland Bureau of Transportation (PBOT) has counted bicycle trips at various locations throughout the city. The majority of these counts have been conducted manually by volunteer counters and city staff standing at street corners and on bridges during the two-hour rush (“peak period”) counting bicycles that pass. In addition to the overall number of trips, PBOT also records the gender of each person and whether they are wearing a helmet. Most counts are still conducted in this manner, though in the early 2000s PBOT added a number of 24-hour automated “hose” counts (pressure-sensitive pneumatic hoses) on some bridges and trails. These counts, while they do not record gender or helmet use, provide a more precise record of the ebb and flow of bicycle traffic over 24-hour periods.
Summary of the 2010 Bicycle Count:
- Bicycle use in Portland continued the two decade long upward trend.
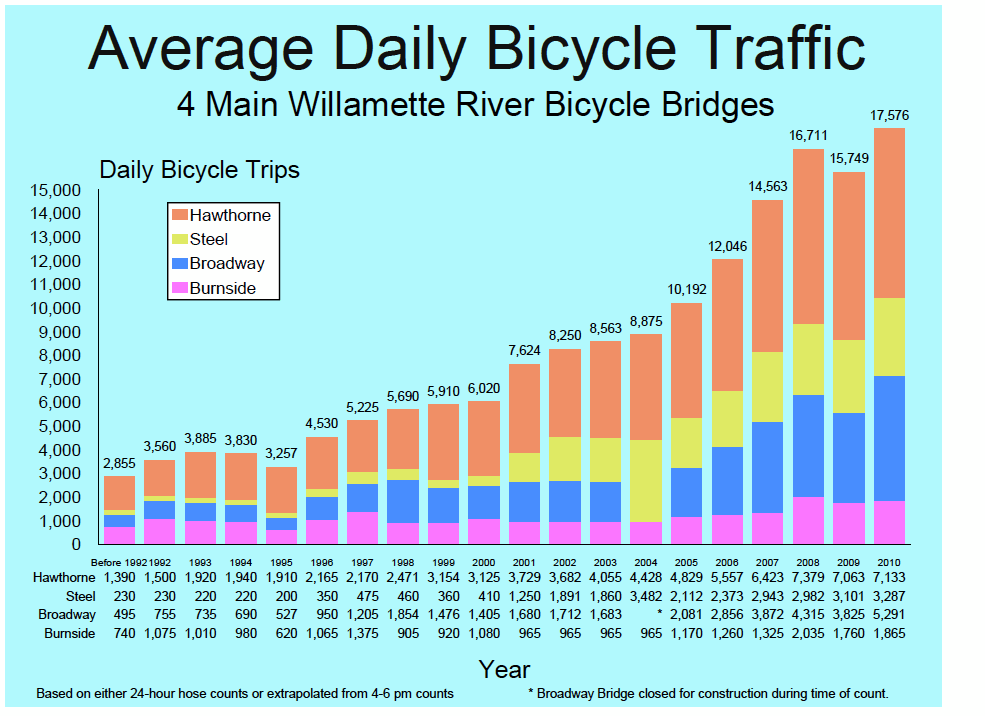
- Bicycle traffic on Portland’s four principal bicycle-friendly bridges (Broadway, Steel, Burnside and Hawthorne bridges) showed the highest number of bicycle trips since annual counts began in 2000/2001.
- Bicycle traffic on Portland’s four principal bicycle-friendly bridges and at 109 nonbridge locations showed a one-year increase of 12 and seven percent respectively. The total number of bicycle trips in Portland (combined bridge and nonbridge) increased eight percent compared with 2009.
- Bicyclists represented approximately 14 percent of all vehicles crossing those bridges, up one percentage point from 2009.
- Bicycles represented approximately 20 percent of all vehicles on the Hawthorne Bridge, down one percentage point from 2009. Bicycles represented 16 , 17 and five percent of all vehicles on the Broadway, Steel and Burnside bridges, respectively, compared to 12 , 18 and five percent in 2009.
- Since the 2000/2001 counts, the overall trend in bicycle traffic was up 190 percent; roughly a tripling in use.
- Helmet use remained the same as in 2009, with 77 percent of all people counted wearing their helmet. Helmet use in 2010 continued to be more prevalent among female riders (83 percent) than for male riders (74 percent).
- Female riders represented 31 percent of bicyclists citywide, showing no change from 2009.
…
Download full version (PDF): Portland Bicycle Count Report 2010
Tags: Bike Lanes, Cycling, OR, Oregon, Portland


 RSS Feed