ALLIANCE FOR BIKING & WALKING
Executive Summary
Making Data Count
For government officials and advocates who promote bicycling and walking in the U.S., it is clear that active transportation is gaining momentum. Protected bicycle lanes are popping up on more city streets, Open Streets initiatives are being organized in communities of all sizes, public bicycle sharing programs are finding success even in sprawling car-centric cities, and business owners are scrambling to install bicycle parking near their front door.
In order to meet the growing desire for more bicycle- and pedestrian-friendly communities, policy makers and advocates need a comprehensive analysis of current trends and trials. The Alliance for Biking & Walking’s Benchmarking Project strives to meet this need by tracking and measuring these efforts across the country.
Documenting Trends
 Benchmarking is a method that helps identify best practices to improve communities for bicycling and walking. It helps officials and advocates to see where their city or state measures up and where they are most in need of improvement. Through benchmarking, new goals can be set, programs evaluated, and continued progress made toward a bicycle-and-pedestrian-friendly United States.
Since 2003, the Benchmarking Project has been documenting the trends in bicycling and walking in U.S. cities and states, as well as at the national level. Alliance researchers compile data from twenty-one U.S. national sources and conduct surveys with the help of state and local government officials and advocates. Updates are published biennially in this report to measure the progress of bicycling and walking over time. This is the fourth publication of Bicycling and Walking in the United States. Previous versions were released in 2007, 2010, and 2012.
Project Objectives
The ultimate goal of the Benchmarking Project is to provide a resource for advocates and professionals who influence the accessibility and safety of bicycling and walking. This report is made available in an effort to accomplish the following primary objectives:
Promote data collection and availability.
Project researchers compile data from all 50 U.S. states, the 50 most populous U.S. cities and, for the first time in this report, 17 midsized cities. These data are summarized in the Benchmarking Report and are available to the public upon request.
Measure progress and evaluate results.
The project began collecting data on bicycling and walking in 2003. As the project continues, it identifies trends and analyzes state and local efforts to provide bicycle- and pedestrian-friendly communities.
Support efforts to increase bicycling and walking.
By providing a means for cities and states to compare themselves to one another, the Benchmarking Report highlights successes, encourages communities making progress, and makes communities aware of the areas where more effort is needed.
Results
Levels of Bicycling and Walking
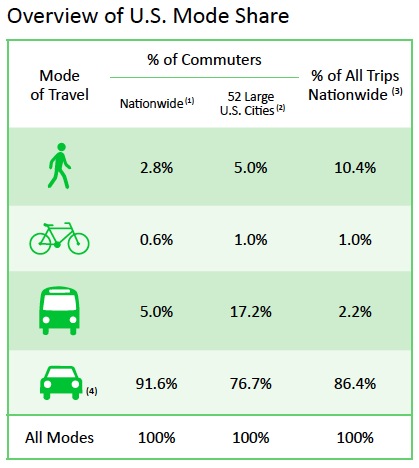
 The most recent nationwide data on bicycling and walking mode share show that only 1.0% of all trips taken in the U.S. are by bicycle, and 10.4% are on foot (NHTS 2009). Of commuters nationwide, 2.8% get to work by walking and 0.6% get to work by bicycle. These numbers are slightly higher in large cities (5.0% and 1.0%, respectively). Though these numbers are low, they represent a continuing gradual increase in bicycling and walking in the U.S.
Partially due to the current lack of data on bicycling and walking numbers, many states and cities conduct their own counts to find out their local mode share. Of the 52 most populous cities surveyed, 43 have completed counts of bicyclists and 37 have completed counts of pedestrians. Thirty-eight states have conducted counts on bicyclists and 36 states have counted pedestrians. States and cities conduct their counts at varying times and frequencies, making it difficult to compare results consistently.
The 2014 benchmarking survey, which collected 2011/2012 data, recorded three types of counts in particular: commuter counts, household surveys, and cordon counts. Cordon counts are conducted to track the number of travelers who cross a specified line into or out of a designated area, such as a neighborhood or downtown, that is “cordoned off.” To read descriptions of other types of counts recorded in the 2014 survey, see pages 59 and 61.
In addition to these, many cities have also conducted other types of counts including installing automated counters and outdoor video cameras, and other types of “spot” counts, which are included in this updated report.
Health and Safety
This report shows the relationship between bicycling and walking to work and several health indicators. Levels of diabetes, high blood pressure, and obesity are all lower in cities with higher shares of commuters bicycling or walking to work. Likewise, where commuters bicycle or walk to work in higher shares, more of the population is meeting the recommended amount of weekly physical activity.
Safety, too, has a close relationship with bicycling and walking levels. In cities where a higher percent of commuters walk or bicycle to work, corresponding fatality rates are generally lower. This is in contrast to critics who fear a higher rate of crashes when more bicyclists and pedestrians use the roadway.
Though bicycle and pedestrian fatalities have seen a slight increase in recent years, the long-term trend is a clear decline. Since 1980, the national pedestrian fatality rate fell from 3.6 fatalities per 100,000 people to 1.4 fatalities per 100,000 people in 2011. Though not as dramatic a drop, the bicyclist fatality rate also decreased, from 0.4 fatalities per 100,000 people in 1980 to 0.2 fatalities per 100,000 people in 2011.
However, some cities have much higher rates of bicycle and pedestrian fatalities. Both Detroit and Jacksonville have pedestrian fatality rates over 4 per 100,000 people. These two cities, as well as Fort Worth, also have the highest bicyclist fatality rates—all see more than three fatalities per 100,000 people.
Economic Benefits
Increasingly, cities and states are publishing studies that show the economic benefits of bicycling and walking. This report provides an overview of some of the most recent studies, which show the positive impact on job growth, individual transportation costs, retail sales, traffic congestion, air quality, property values and stability, health and worker productivity, and events and tourism.
Twenty-two states, ten of the 52 most populous cities, and five of the mid-sized cities have conducted an economic impact study. Most of these studies looked at the impact of bicycling, but other studies show the impact of walking and trails. Washington state and New York City have also studied the economic impact of car-free zones.
Policies and Funding
Since 2010, 11 states and 12 of the 52 most populous cities have added new goals to increase bicycling and walking, or to decrease bicycle and pedestrian fatalities. Overall, 88% of states and 90% of the most populous cities currently report having at least one of these goals. Nine large cities and one state (Georgia) have recently passed Complete Streets legislation or policies. Currently, 54% of states and 52% of cities now have Complete Streets policies or legislation.
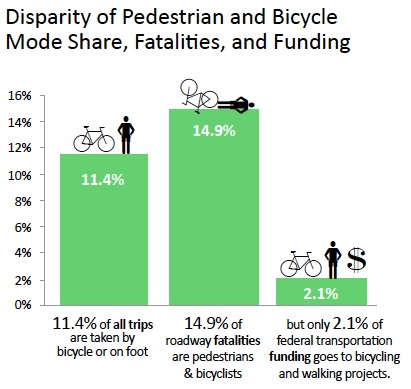
For the first time, over 2% of federal transportation funding went to bicycle and pedestrian projects. Recognizing that this is still a disproportionately low level of dedicated funding, it is also a continuation of increasing funds to bicycling and walking over the years.
MAP-21, the federal transportation law passed in 2012, raised some concern that states and cities will have less access to these funds for bicycling and walking improvements. The federal Transportation Enhancements (TE) program has historically been the largest single source of dedicated funding for bicycle and pedestrian projects. However, with MAP-21, TE, Safe Routes to School (SRTS), and the Recreational Trails Program (RTP) have been consolidated into the Transportation Alternatives Program (TAP), with a specific set-aside for the RTP. Funds for TAP are 26% less in fiscal year 2014 than the combined funding for these three separate programs in 2012. However, bicycle and pedestrian projects are eligible for all Federal-aid Highway Program categories.
Infrastructure and Design
The 50 most populous cities in the U.S. (plus New Orleans and Honolulu) have a combined total of more than 8,600 miles of bicycle lanes. Combining the mileage of bicycle lanes, multi-use paths, and signed bicycle routes in these cities, they have an average of 1.6 miles of bicycle infrastructure per square mile. This is an increase from 1.3 miles per square mile in 2010 (reported in the 2012 Benchmarking Report). San Francisco has, by far, the densest network of bicycle facilities with 7.8 miles of lanes, paths, and routes per square mile in the city.
Download full version (bikewalkalliance.org): Bicycling and Walking in the United States
About the Alliance for Biking & Walking
bikewalkalliance.org
“The Alliance for Biking & Walking creates, strengthens, and unites state and local bicycling and walking advocacy organizations. We give advocates tools to win campaigns that transform communities into great places to bike and walk. “
Tags: Alliance for Biking & Walking, Bicycling, Bike Lanes, Cycling, Pedestrian


 RSS Feed