SOLAR ELECTRIC POWER ASSOCIATION (SEPA)
Executive Summary
Solar markets continued significant growth in 2014
- Added 5.3 gigawatts (GW)1 across more than 182,000 new systems; total installed solar nationwide is 16.3 GW across more than 675,500 locations.
- Annual capacity growth rates for the following market segments: Residential: 36%; Nonresidential: 12%; Utility-scale: 23%
- Solar costs are declining with an industry wide drive to lower non hardware soft costs in areas such as financing and customer acquisition.
The solar market is heavily concentrated in particular utilities and states
- Most solar-active utilities are in California, Hawaii, Arizona, New Jersey, and North Carolina.
- Aggregate solar portfolio by utility type:
• Investor-owned: 50% of capacity is made of utility-scale solar projects
• Public power: Residential and nonresidential rather than utility-scale2 solar drive capacity
• Cooperative: Portfolios are composed of an equal mix of utility-scale, residential and nonresidential solar
Key business issues likely to persist for the next 2 to 3 years
- Rate restructuring to account for distributed energy resources will continue to drive discussion amongst utilities, regulators and stakeholders.
- Utilities, as well as regulators, need to innovate to meet evolving customer demands for clean, affordable electricity.
- Forecasts are predicting a very sharp drop in solar build-out after the federal tax incentive steps down in 2017.
- Grid integration of distributed energy resources is emerging as an opportunity for technical adaptation and improved utility planning procedures.
- Community solar programs continue to receive strong interest from utilities of all types.
- Solar is increasingly becoming a least-cost option for utilities.
Solar market expansion is driven by several factors: policy support for for renewable resources, the level of retail rates, the availability of incentives, and the strength of the solar resource, among others.
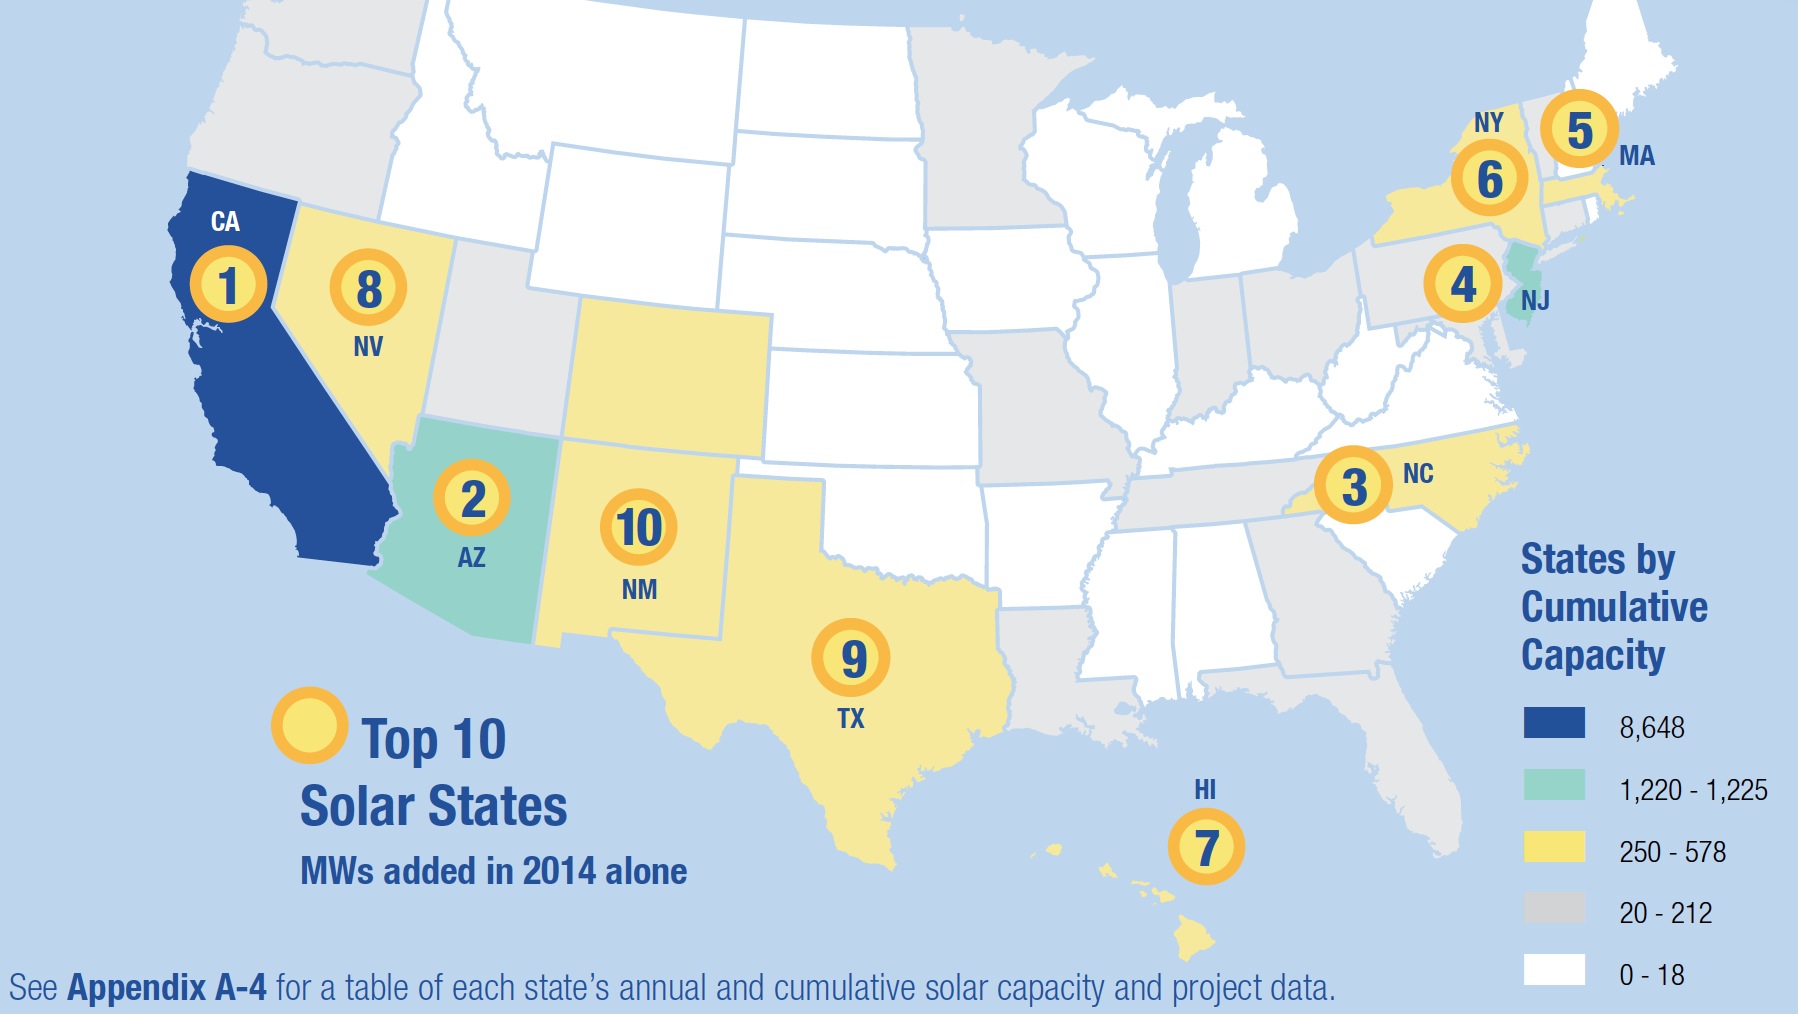
- California, the leading state for solar growth, has an aggressive renewable portfolio standard (RPS) and other complementary state policies supporting solar development.
- Both California and Arizona, the second place state for annual solar growth, have significantly higher solar production compared to the rest of the nation.3 Greater solar insolation boosts the economics of solar, in some instances making the cost of solar energy competitive with the price of natural gas.
- North Carolina, the third place state for annual solar growth, has been climbing the charts for most competitive solar state over the past several years. Factors influencing its solar uptake include its RPS and state tax credit, and long-term power purchase agreements with fixed prices that provide competitive economics for many of the state’s developers.
- New Jersey, another state with significant solar penetration, bolsters its market with solar renewable energy credits (SRECs) that are traded for compliance purposes.
Download full version (PDF): Utility Solar Market Snapshot
About the Solar Electric Power Association (SEPA)
www.solarelectricpower.org
The Solar Electric Power Association (SEPA) is an educational non-profit organization dedicated to helping utilities integrate solar energy into their portfolio.


 RSS Feed