


SOLAR ENERGY INDUSTRIES ASSOCIATION
Introduction
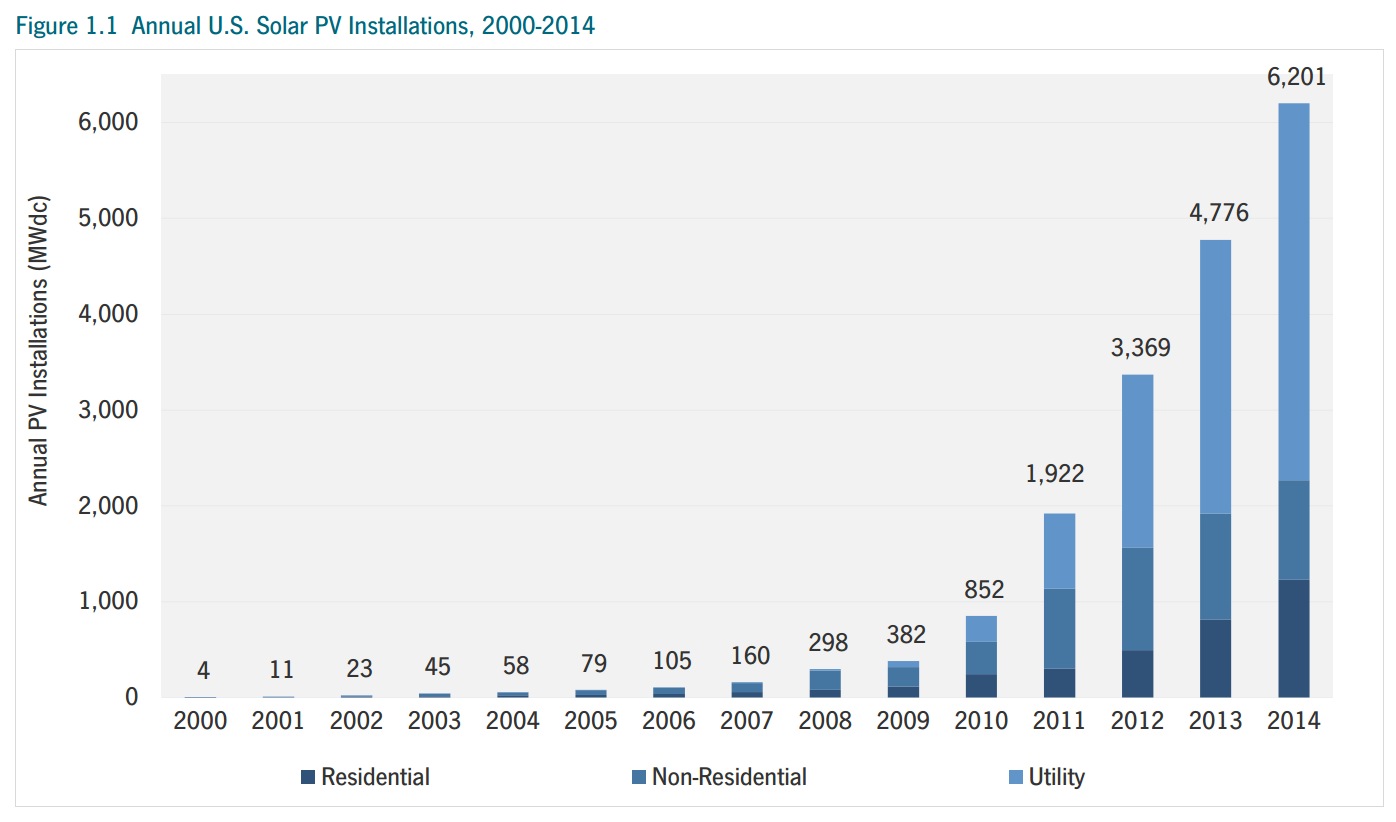
Solar energy posted another banner year in the U.S. in 2014. Photovoltaic (PV) installations reached 6,201 MWdc, up 30% over 2013 and more than 12 times the amount installed five years earlier. By the end of the year, a cumulative total of 18.3 GWdc of solar PV and another 2.2 GWac of concentrating solar power (CSP) were operating in the U.S. Over 600,000 homes and businesses now have on-site solar (nearly 200,000 of these installations were completed in 2014), and six states are home to more than 500 MWdc each of operating solar capacity.
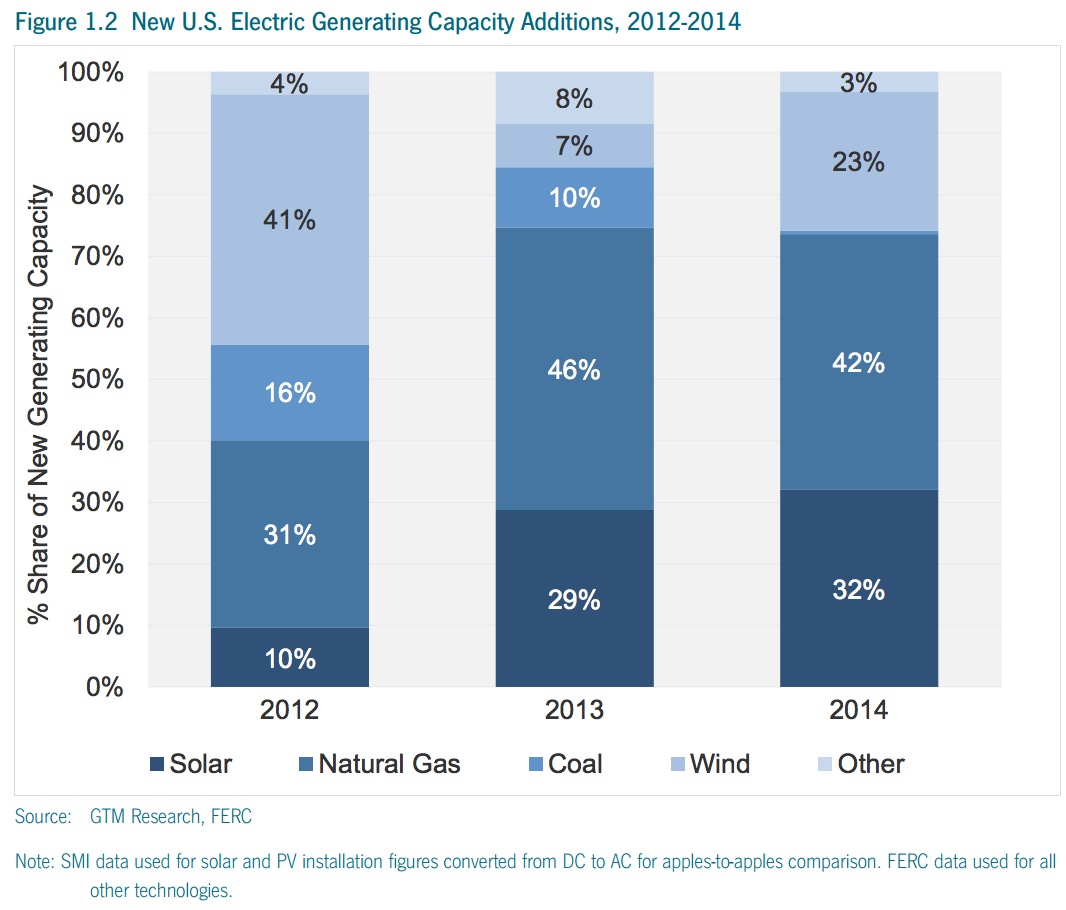
As solar has grown in the U.S. over the past few years, so has its share of total new electricity generation capacity. In 2014, solar accounted for 32% of new generating capacity in the U.S., second only to natural gas.
Three fundamental drivers have contributed to solar’s continued growth in the U.S.
1. Falling costs: The cost of solar continues to fall across segments and states. While PV module prices remained relatively flat in 2014, balance-of-systems (BOS) prices fell precipitously, leading to an average 10% annual decline in system prices, depending on the market segment. In many states, solar is on the cusp of economic feasibility, so each incremental decline in prices opens up the market to new potential customers and makes solar more competitive with the alternative, whether that’s retail electricity or new combined-cycle natural gas plants.
2. Downstream innovation and expansion: As the cost of solar has fallen, solar companies have created new and better ways to make solar available and attractive to more customers. In the residential market, the advent of financial solutions including power-purchase agreements (PPAs), leases and increasingly solar-optimized loans has opened up a wide swath of demand that previously did not exist. In the commercial market, developers sell multi-site portfolios to retailers, standardize their contracts to streamline financing, and now offer energy storage as an add-on to maximize solar’s benefits by reducing demand charges. And in the utility-scale market, developers have sought procurement mechanismsoutside utility regulatory or legislative requirements, resulting in over 4 GWdc of new PPAs signed through non-traditional means over the past 12 months.
3. Stable policy and regulation: Despite an increasing number of proceedings regarding solar and electricity rate structures, the regulatory and policy environment for solar in the U.S. has generally been stable for the past few years. At the federal level, the industry has benefitted from the federal 30% Investment Tax Credit (more on that to follow), and most state policies have been reasonably clear and visible. As a result, businesses have been able to plan strategically and chart a clear course for expansion.
Without question, 2015 will be another growth year for U.S. solar. But a number of factors will dictate the course and trajectory of growth. Some key themes to watch in 2015:
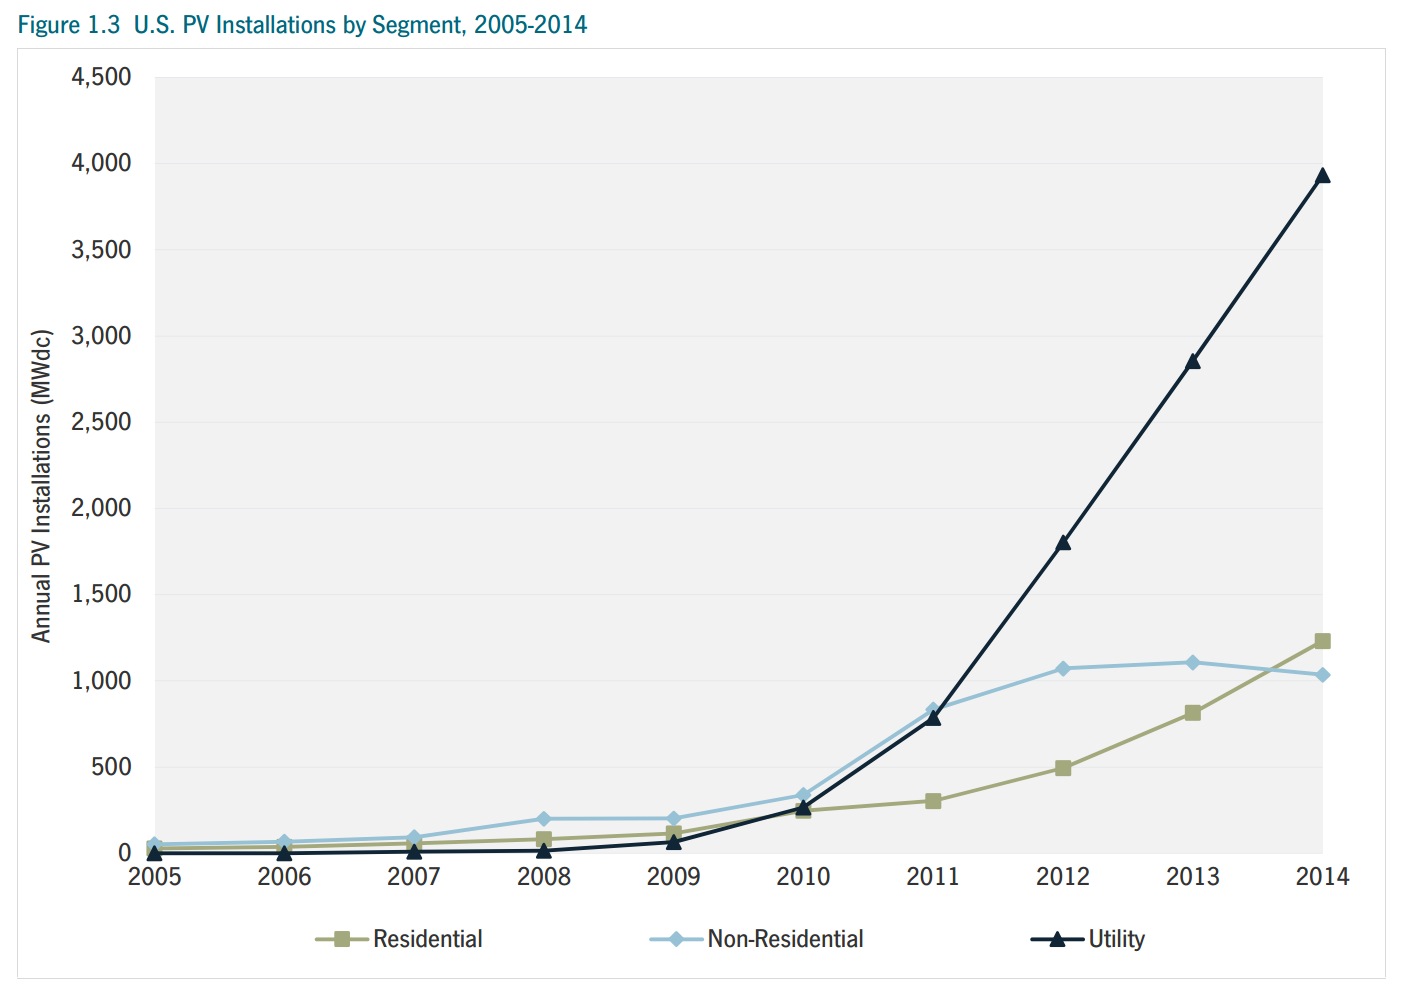
- The residential solar boom continues, but rate structure revisions threaten growth. Home solar has been a consistent growth story over the past three years, posting annual growth rates over 50% in 2012, 2013 and 2014. But as we detail in this report, there are more than 20 ongoing proceedings that could impact residential solar’s value proposition through either changes to net energy metering or electricity rate structures. 2015 will be the year in which some of the most prominent proceedings (most notably California’s AB 327) start to see resolution, while new debates will undoubtedly emerge.
- Commercial solar is seeking a comeback. While residential solar has soared in the U.S., commercial solar has stagnated. In 2014, just over 1,000 MWdc of commercial solar capacity was installed, down 6% from 2013 and even down 3% from 2012. Many factors have contributed to this trend, ranging from tight economics to difficulty financing small commercial installations. But 2015 will be a telling year for the commercial market. Many participants expect a pickup in demand in key states including California, New Jersey and New York, which, if proven true, could reignite the sector and bring it back on pace with the residential market.
- The enormous utility-scale solar pipeline comes to fruition. There are just over 14 GWdc of utility-scale solar projects in the U.S. with power-purchase agreements in place and expected completion dates of 2015 or 2016. The next two years will see a flurry of project completion announcements and unprecedented installation figures from the utility solar sector. There is no question that this segment will remain by far the largest in terms of annual capacity additions through 2016, but its fate after the 2017 ITC expiration remains in doubt.
Download Executive Summary (PDF): U.S. Solar Market Insight Report
About the Solar Energy Industries Association
www.SEIA.org
As the national trade association in the U.S., the Solar Energy Industries Association (SEIA) is the power behind solar energy. Our member companies research, manufacture, distribute, finance, and build solar projects domestically and abroad.
Tags: PV, SEIA, Solar Energy, Solar Energy Industries Association
 RSS Feed