


TRIP
Executive Summary
Connecticut’s bridges are a critical element of the state’s transportation system, supporting commerce, economic vitality and personal mobility. As the backbone of the state’s economy, Connecticut’s transportation system enables the state’s residents and visitors to travel to work and school, visit family and friends, and frequent tourist and recreation attractions, while providing its businesses with reliable access to customers, materials, suppliers and employees.
 As vehicle travel increases, maintaining Connecticut’s aging transportation network, including its bridges, will become more difficult. A significant number of Connecticut’s bridges have surpassed or are approaching 50 years old, which is typically the initial intended design life for bridges of that age. In fact, 59 percent of the state’s bridges are 50 years or older, the fourth highest rate in the nation. The average age of all Connecticut’s bridges is 53 years, while the average age of the state’s more than 300 structurally deficient bridges is 69 years. The cost of repairing and preserving bridges increases as they age and as they reach the end of their intended design life.
To retain businesses, accommodate population and economic growth, maintain economic competitiveness, and achieve further economic growth, Connecticut will need to maintain and modernize its bridges by repairing or replacing deficient bridges and providing needed maintenance on other bridges to ensure that they remain in good condition as long as possible. Making needed improvements to Connecticut’s bridges will require increased and reliable funding from local, state and federal governments, which will also provide a significant boost to the state’s economy by creating jobs in the short term and stimulating long term economic growth as a result of preserved and enhanced mobility and access.
POPULATION AND VEHICLE TRAVEL GROWTH
Increased demands on Connecticut’s major roads, highways and bridges, leads to additional wear and tear on its transportation system.
- Connecticut’s population reached approximately 3.6 million residents in 2017, a five percent increase since 2000. Connecticut had 2.6 million licensed drivers in 2016.
- Vehicle miles traveled (VMT) in Connecticut increased three percent from 2000 to 2016, from 30.8 million VMT to 31.6 million VMT. From 2013 to 2016 VMT increased two percent. By 2030, vehicle travel in Connecticut is projected to increase by ten percent.
- From 2000 to 2016, Connecticut’s gross domestic product (GDP), a measure of the state’s economic output, increased by nine percent, when adjusted for inflation. U.S. GDP increased by 30 percent from 2000 to 2016, when adjusted for inflation.
CONNECTICUT BRIDGE CONDITIONS
More than three hundred of locally and state-maintained bridges in Connecticut are structurally deficient, meaning there is significant deterioration to the major components of the bridge.
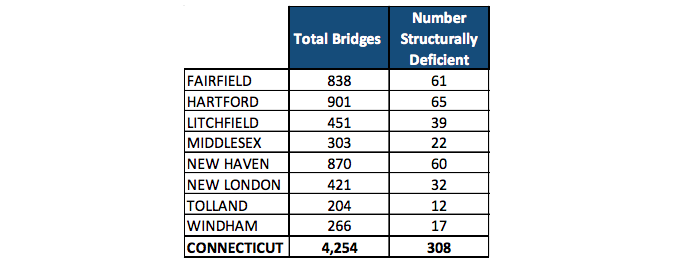
- There are a total of 4,254 bridges in Connecticut that are 20 feet or longer. These bridges are maintained by local and state agencies.
- Three hundred and eight of Connecticut’s state-and locally maintained bridges are structurally deficient.
- Structurally deficient bridges in Connecticut are crossed daily by 4.3 million vehicles.
- Bridges that are structurally deficient may be posted for lower weight limits or closed if their condition warrants such action. Deteriorated bridges can have a significant impact on daily life. Restrictions on vehicle weight may cause many vehicles – especially emergency vehicles, commercial trucks, school buses and farm equipment – to use alternate routes to avoid weight-restricted bridges. Redirected trips also lengthen travel time, waste fuel and reduce the efficiency of the local economy.
- The condition of the bridge deck, substructure and superstructure are inspected typically every two years and rated on a score of 1-9. A bridge is deemed structurally deficient if at least one component receives a score of four or lower. The actual prioritization for repair or replacement of deficient bridges is at the discretion of state or local transportation agencies.
- A significant number of Connecticut’s bridges have surpassed or are approaching 50 years old, which is typically the initial intended design life for bridges of that age. Fifty-nine percent of the state’s bridges are 50 years or older. The average age of all Connecticut’s bridges is 53 years, while the average age of the state’s more than 300 structurally deficient bridges is 69 years. The cost of repairing and preserving bridges increases as they age and as they reach the end of their initial intended design life.
- The chart below details the number and share of structurally deficient bridges in each Connecticut county and statewide.
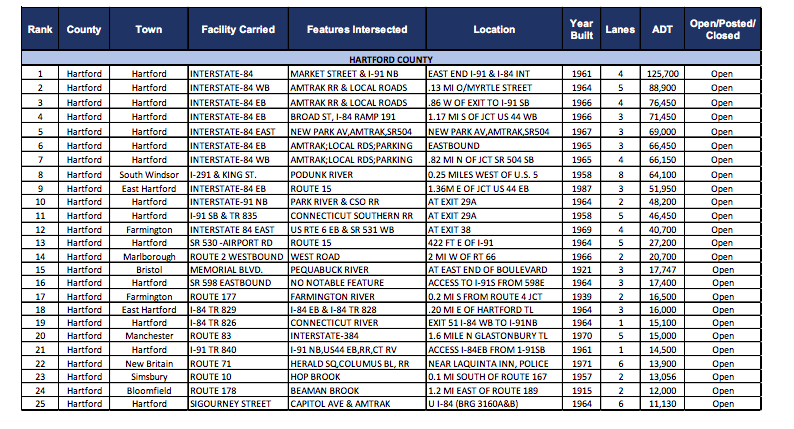
- The list below details the 25 most heavily traveled structurally deficient bridges in Hartford County (carrying a minimum of 500 vehicles per day). ADT is average daily traffic. The report appendix includes each bridge’s rating score for deck, superstructure and substructure.
***
TRANSPORTATION FUNDING AND PRESERVING CONNECTICUT’S AGING BRIDGES
Maintaining aging bridges becomes more costly as they reach the limits of their design life, challenging state and local transportation agencies to take an asset management approach to bridge preservation that emphasizes enhanced maintenance techniques that keep infrastructure in good condition as long as possible, delaying the need for costly reconstruction or replacement.
- Repairing and replacing bridges in poor condition and preserving bridges in fair and good condition will require increased and reliable funding from local, state and federal governments.
- A recent survey of states by the U.S. General Accountability Office (GAO) found that more than half of states surveyed (14 out of 24) reported that inadequate funding was a challenge to their ability to maintain bridges in a state of good repair.
- Under pressure from fiscal constraints, aging bridges, and increased wear due to growing travel volume, particularly by large trucks, transportation agencies are adopting cost-effective strategies focused on keeping bridges in good condition as long as possible. While this strategy requires increased initial investment, it saves money over the long run by extending the lifespan of bridges.
- The GAO Report found that the increase in the number and size of bridges that are approaching the limits of their design life will likely place a greater demand on bridge owners in the near future, making it more difficult to mitigate issues in a cost-effective manner.
- A survey included in the GAO report found that more than half of states surveyed (13 out of 24) indicated that the advanced age of many bridges posed a challenge to their ability to maintain their bridges in a state of good repair.
- Bridge preservation may include washing, sealing deck joints, facilitating drainage, sealing concrete, painting steel, removing channel debris, and protecting against stream erosion.
- Rehabilitation involves all major work required to restore the structural integrity of a bridge and raise the bridge’s ratings to better than “poor” condition. Rehabilitation may also include superstructure replacements and bridge widening, as well as work necessary to correct major safety defects.
- Replacement projects involve total replacement of a bridge to current standards.
- The need to repair or replace high priority bridges may create a funding cycle that makes it difficult to keep pace with the needed preservation activities.
TRANSPORTATION AND ECONOMIC GROWTH IN CONNECTICUT
The efficiency of Connecticut’s transportation system, particularly its roads, highways and bridges, is critical to the health of the state’s economy. Businesses rely on an efficient and dependable transportation system to move products and services. A key component in business efficiency and success is the level and ease of access to customers, markets, materials and workers.
- Annually, $489 billion in goods are shipped to and from sites in Connecticut, largely by truck.
- Businesses have responded to improved communications and greater competition by moving from a push-style distribution system, which relies on low-cost movement of bulk commodities and large-scale warehousing, to a pull-style distribution system, which relies on smaller, more strategic and time-sensitive movement of goods.
- Increasingly, companies are looking at the quality of a region’s transportation system when deciding where to re-locate or expand. Regions with congested or poorly maintained roads may see businesses relocate to areas with a smoother, more efficient and more modern transportation system. Highway accessibility was ranked the number one site selection factor in a 2017 survey of corporate executives by Area Development Magazine. Labor costs and the availability of skilled labor, which are both impacted by a site’s level of accessibility, were rated second and third, respectively.
- The design, construction and maintenance of transportation infrastructure in Connecticut supports 38,364 full-time jobs across all sectors of the state economy. These workers earn $1.9 billion annually. Approximately 731,000 full-time jobs in Connecticut in key industries like tourism, retail sales, agriculture and manufacturing are completely dependent on the state’s transportation network.
Sources of information for this report include the Connecticut Department of Transportation (CTDOT), the Federal Highway Administration (FHWA), the National Bridge Inventory (NBI), the Bureau of Transportation Statistics (BTS), the American Road and Transportation Builders Association (ARTBA), and the U.S. Census Bureau.
Download full version (PDF): Preserving Connecticut’s Bridges
About TRIP
www.tripnet.org
Founded in 1971, TRIP ® of Washington, DC, is a nonprofit organization that researches, evaluates and distributes economic and technical data on surface transportation issues. TRIP is sponsored by insurance companies, equipment manufacturers, distributors and suppliers; businesses involved in highway and transit engineering and construction; labor unions; and organizations concerned with efficient and safe surface transportation.
Tags: Connecticut, CT, structurally deficient, TRIP
 RSS Feed