UNITED STATES DEPARTMENT OF TRANSPORTATION
BUREAU OF TRANSPORTATION STATISTICS
The Transportation Statistics Annual Report describes the Nation’s transportation system, the system’s performance, its contributions to the economy, and its effects on people and the environment. This 18th edition of the report is based on information collected or compiled by the Bureau of Transportation Statistics (BTS), a Federal statistical agency within the U.S. Department of Transportation (USDOT).
Over 4 million miles of roads, more than 19,000 public and private use airports, about 140,000 miles of freight and passenger railroads, 25,000 miles of navigable waterways, and 2 million miles of pipelines connect the Nation’s people and businesses across the continent and with the rest of the world.
The estimated value of U.S. transportation assets in 2012 was $7.7 trillion. The public owns 51.2 percent of the total transportation asset value, mostly highways and streets, but also publicly held airports, waterways, and transit facilities. Private companies own 31.2 percent of transportation assets, including railroads, pipelines, trucks, planes, and ships.
Personal motor vehicles account for the remaining 17.7 percent.
The average person travels more than 13,600 miles per year, and domestic businesses ship and receive 63 tons of freight per year on average for every man, woman, and child in the United States.
The transportation sector accounts for:
- over $1 trillion in purchases and investments in transportation goods and services,
- $134 billion of public expenditures on operations and maintenance of the U.S. transportation system—just more than one-third of which was spent on highways,
- nearly 12 million jobs in transportation-related industries,
- nearly $9,000 average expenditures for each household per year,
- nearly 34,400 lives lost and over 2 million nonfatal injuries each year,
- 70.1 percent of total petroleum consumption in the United States, and
- about 1.8 billion annual metric tons of carbon dioxide emissions.
…
Chapter 1
Extent of the U.S. Transportation System
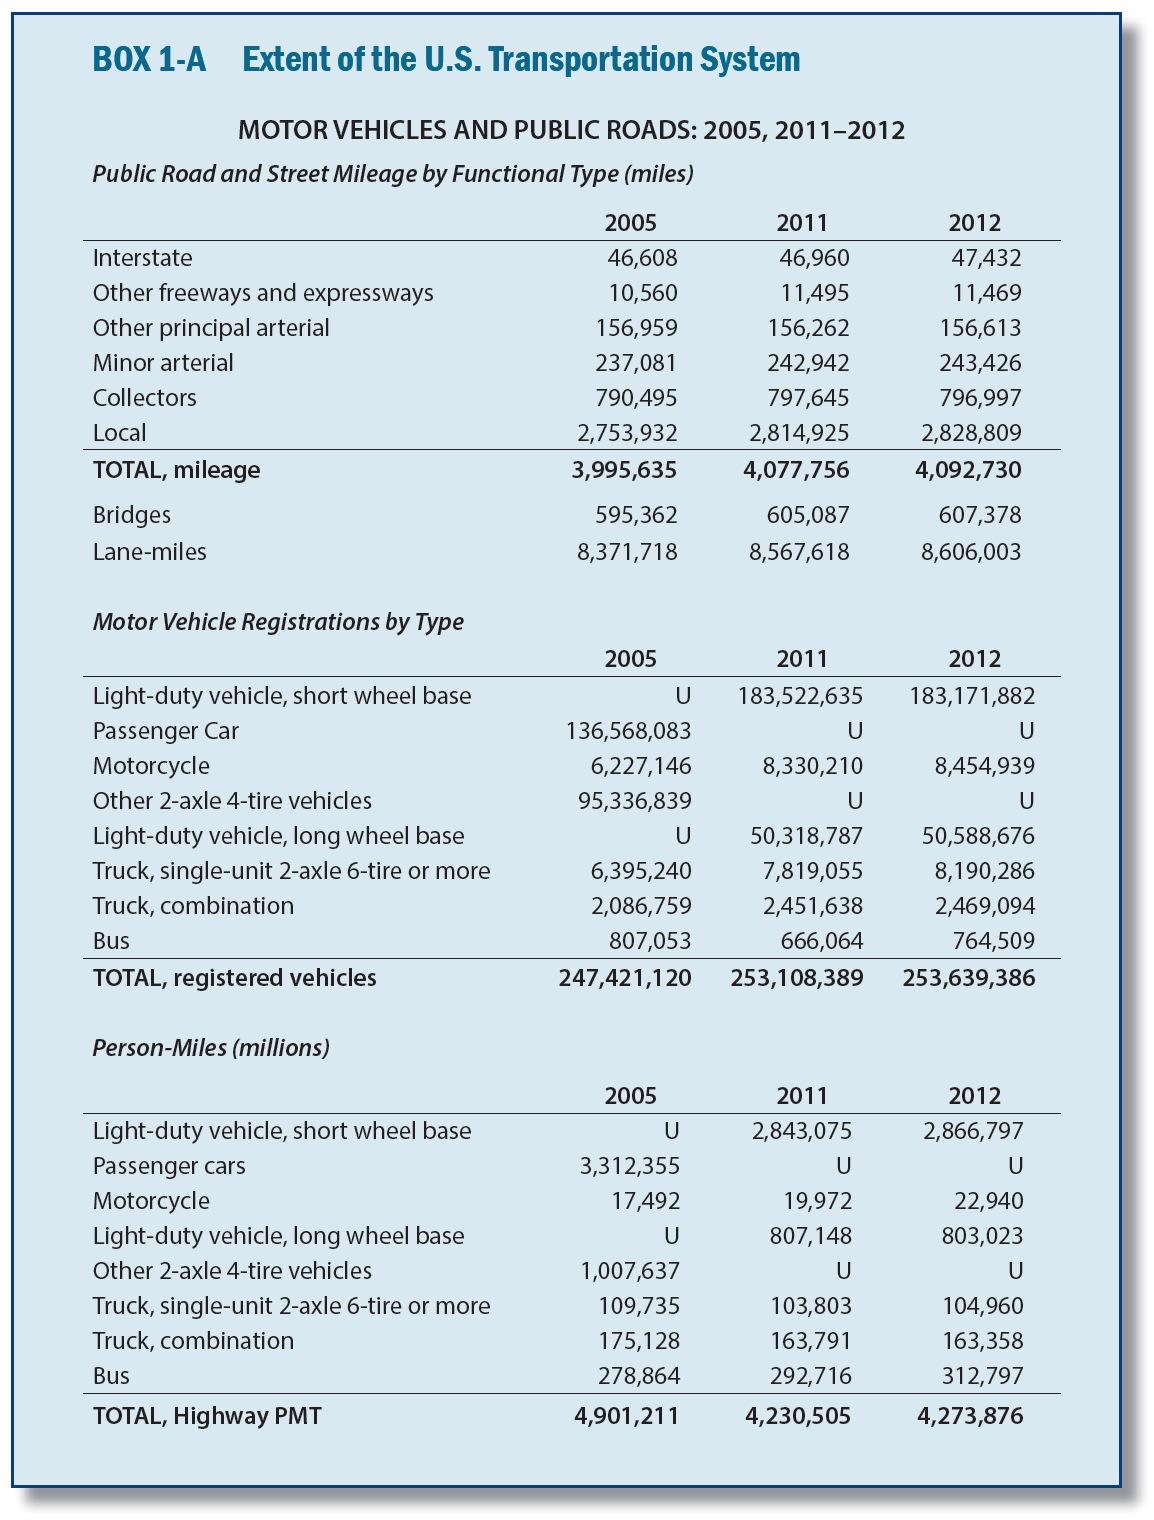
The Nation’s transportation infrastructure comprises more than 4 million miles of roads, about 19,400 public and private use airports, nearly 95,400 miles of Class I railroads,1 and 25,000 miles of navigable waterways as detailed in box 1-A. While China’s and India’s transportation systems serve many more people (an estimated 1.5 billion and 1.2 billion, respectively, in 2013), the United States ranks first in the number of airports and miles of roads and freight rail [USCIA 2013]. In 2013 the U.S. transportation system served 316.1 million residents plus millions of businesses and visitors—7.4 million and 67 million, respectively [USDOC CENSUS 2014].
- Lane-miles increased 0.4 percent between 2011 and 2012. Highway person-miles traveled and vehicle-miles traveled increased by 1.0 and 0.6 percent, respectively, from 2011 to 2012.
- The Nation’s transportation assets were valued at approximately $7.7 trillion in 2012, an increase of 4.1 percent over 2011 estimates. Publicly owned infrastructure and equipment accounted for the majority of transportation capital stock.
- In 2012 the value of transportation construction increased 4.0 percent over 2011 levels, reaching $119 billion, of which 67.8 percent was spent on street and highway construction.
- According to the Bureau of Transportation Statistics’ Transportation Services Index, the volume of freight transportation services grew 23.3 percent between April 2009 (the low point for the freight index of 94.8) and December 2013, while the volume of passenger transportation services increased 9.3 percent between March 2009 (the low point for the passenger index of 108.4) and December 2013. The lows for both indexes occurred during the economic recession spanning December 2007 to June 2009.
Download full version (PDF): Transportation Statistics Annual Report
About the Bureau of Transportation Statistics
www.rita.dot.gov/bts/
The Bureau of Transportation Statistics (BTS) was established as a statistical agency in 1992. The Intermodal Surface Transportation Efficiency Act (ISTEA)of 1991 created BTS to administer data collection, analysis, and reporting and to ensure the most cost-effective use of transportation-monitoring resources. BTS brings a greater degree of coordination, comparability, and quality standards to transportation data, and facilitates in the closing of important data gaps.
Tags: BTS, Bureau of Transportation Statistics, RITA, United States Department of Transportation, USDOT


 RSS Feed