NATIONAL TRANSPORTATION ENHANCEMENTS CLEARINGHOUSE
Executive Summary
Transportation Enhancement (TE) projects improve the quality of America’s transportation infrastructure. Congress defined and structured the TE activities to establish community livability as a priority. TE funding helps build a transportation system that provides diverse travel choices and supports our natural, economic, and social vitality.
Since its inception in 1992, the TE set-aside has provided over $13 billion to the states. This report documents and analyzes how the 50 states and the District of Columbia have used this funding.
The National Transportation Enhancements Clearinghouse (NTEC) is operated by the Rails-to-Trails Conservancy under a cooperative agreement with the Federal Highway Administration (FHWA). NTEC provides transparency to a complex set-aside, promotes best practices, and provides citizens, professionals, and policy-makers with information and technical assistance.
Data in this report were obtained from the FHWA Fiscal Management Information System (FMIS) and the NTEC project database, which was developed through over 16 years of direct interaction with staff and data systems at each of the state transportation agencies. This report publishes statis- tics that provide insight into how TE funds are used at the national and state levels. The report is a tool for agency staff, policy makers, professionals, and citizens who are striving to enhance America’s transportation system and its communities.
Spending Analysis
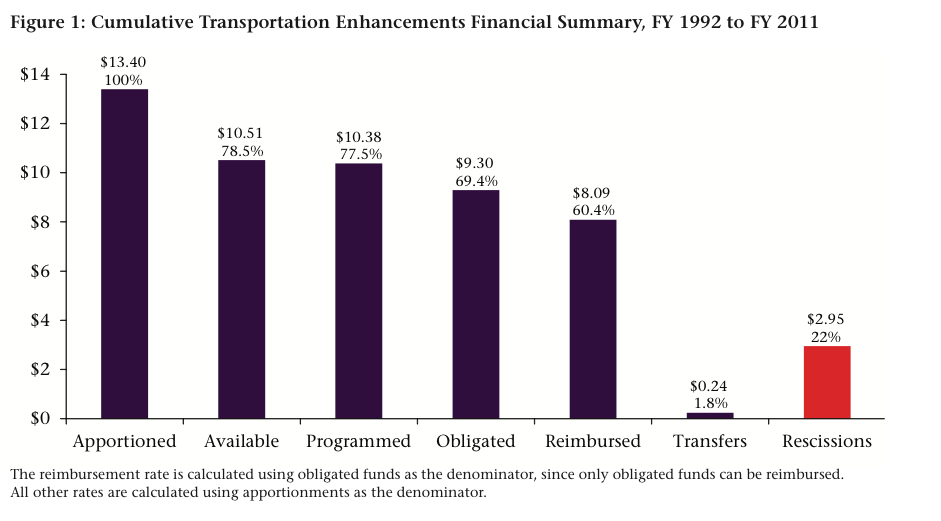
Figure 1 on page 3 illustrates the status of funding at the national level through fiscal year (FY) 2011. From 1992 through 2011, Congress apportioned over $13 billion to the states for TE projects. NTEC’s up- to-date nationwide project listing shows that state Departments of Transportation (DOTs) programmed 77.5% of this funding for 27,009 projects through FY 2011.
In 2009, NTEC reported that state DOTs had obligated 89% of available funding, a substantial increase from previous years. However, the increase was a distortion caused by rescissions, not because of a dramatic increase in new obligations. As of the close of FY 2011, states had obligated 88% of available funds. However, these cumulative obligations represent only 69% of the original apportionments. Thus, starting with the 2010 report, the obligation rate is calculated as a percentage of apportionments in addition to the previous rate based on available funding. In FY 2011 itself, states rescinded TE funding nearly equal to 60% of the amount obligated to new projects ($550 million and $325 million, respectively). On the plus side, $788 million in additional funds for TE were obligated through implementation of the 2009 American Recovery and Reinvestment Act (ARRA) in FY 2009 and FY 2010.
The financial path of a successfully completed TE project ends with reimbursement, which is the moment at which federal dollars are actually dispersed to the project sponsor. The reimbursement rate for obligated funding through FY 2011 is at 87%, holding steady since FY 2008. Obligation and reimbursement rates are performance measures for project implementation. States continue to seek best practices to improve TE project delivery and increase reimbursement rates.
The 2011 fiscal year was a challenging one for state departments of transportation, due to the uncertain status of the federal transportation program as Congress negotiates a new spending authorization, and widespread state budget crises. Since SAFETEA-LU expired in September, 2009, it has been extended through 9 short-term extensions with the most recent set to expire June 30th, 2012.
Nationwide Priorities for Transportation Enhancement Funding
The consistent leading priority in TE investment since 1992 has been to improve conditions for walking and bicycling, followed by landscaping and beautification, and then preservation and rehabilitation of historic transportation infrastructure. Bicycle and pedestrian facilities, combined with rail-trails and bike/ped safety programs, comprise 58% of programmed funding between FY 1992 and FY 2011. Landscaping and scenic beautification received 19% of TE funding. Historic preservation and rehabilitation of historic transportation facilities received 13% of TE funding. The other six categories combined account for the remaining 11% of programmed funding.
Lessons of FY 2011
The 2011 fiscal year was one of extremes. A June 2011 rescission of $2.5 billion overall impacted TE disproportionately with $324 million retracted from this set-aside alone. While the TE set-aside comprises only 2.3% of the Federal-aid Highway Program (FAHP), 13% of rescinded funds were from the TE set-aside. This reflects the actions of roughly half of the states. Some of these same states suspended or scaled back implementation of their TE set-asides due to shifting priorities and uncertainty surrounding reauthorization. Spending trends of other states demonstrate a commitment to the set-aside and even increased funding for these activities. Growth in the TE project list, obligation trends, and matching funds leveraged show that these states are affirming their commitment to delivering the small-scale, large-impact livable infrastructure projects represented by TE.
Read full report (PDF) here: Transportation Enhancements Spending Report
About The National Transportation Enhancements Clearinghouse
enhancements.org
“The National Transportation Enhancements Clearinghouse (NTEC) is an information service sponsored by the Federal Highway Administration (FHWA) and Rails-to-Trails Conservancy. NTEC works to provide professionals, policy makers, and citizens with timely and accurate information necessary to make well-informed decisions about Transportation Enhancements (TE). This Web site explains all the particulars of the TE program, including information on applying for TE funds, how funds are distributed and how TE is managed by each state. Additionally, you will find a directory of important TE contacts in your state and a database of completed TE projects, to name a few.”
Tags: Federal Highway Administration, FHWA, Fiscal Managaement Information System, FMIS, National Transportation Enhancements Clearinghouse, NTEC, TE, Transportation Enhancement


 RSS Feed