


SAN FRANCISCO COUNTY TRANSPORTATION AUTHORITY
Executive Summary
 Congestion in San Francisco worsened between 2010 and 2016. The Transportation Authority’s Congestion Management Program monitoring indicates that average AM peak arterial travel speeds decreased since 2009 by -26%, while PM peak arterial speeds have decreased by -27% during this same time period. Vehicle hours of delay on the major roadways increased by 40,000 hours on a typical weekday, while vehicle miles travelled on major roadways increased by over 630,000 miles on a typical weekday.
During this period significant changes occurred in San Francisco. Roadway and transit networks changed, including the implementation of transit red carpet lanes, the expansion of the bicycle network, and the opening of the Presidio Parkway (rebuilt Doyle Drive). San Francisco added 70,000 new residents and over 150,000 new jobs, and these new residents and workers added more trips to the City’s transportation network. Finally, new mobility alternatives emerged, most visibly TNCs.
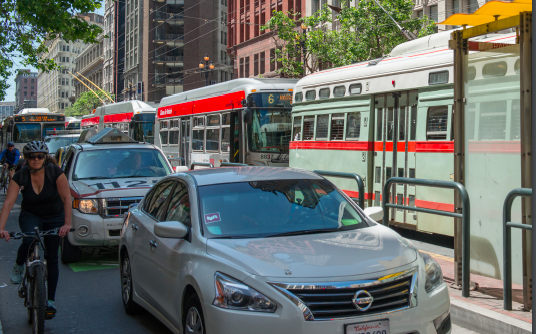
In recent years, the vehicles of transportation network companies (TNCs) such as Uber and Lyft have become ubiquitous in San Francisco and many other major cities. Worldwide, the total number of rides on Uber and Lyft grew from an estimated 190 million in 2014 to over 2 billion by mid-2016. In San Francisco, this agency (the San Francisco County Transportation Authority or SFCTA) estimated approximately 62 million TNC trips in late 2016, comprising about 15% of all intra-San Francisco vehicle trips and 9% of all intra-San Francisco person trips that fall.
The rapid growth of TNCs is attributable to the numerous advantages and conveniences that TNCs provide over other modes of transportation, including point-to-point service, ease of reserving rides, shorter wait times, lower fares (relative to taxis), ease of payment, and real-time communication with drivers. The availability of this new travel alternative provides improved mobility for some San Francisco residents, workers and visitors, who make over one million TNC trips in San Francisco every week, though these TNC trips may conflict with other City goals and policies.
The purpose of this report is to identify the extent to which TNCs contributed to increased roadway congestion in San Francisco between 2010 and 2016, relative to other potential contributing factors including employment growth, population growth, and changes to the transportation system. This information is needed to help the Transportation Authority fulfill our role as the county Congestion Management Agency and inform our policy and planning work. As the Congestion Management Agency for San Francisco, the Transportation Authority is required by state law to monitor congestion and adopt plans for mitigating traffic congestion that falls below certain thresholds. The report is also intended to inform the Transportation Authority board which is comprised of the members of the San Francisco Board of Supervisors, as well as other state and local policy-makers, and the general public, on the relationship between TNCs and congestion in San Francisco.
This document:
- Identifies common measures of roadway congestion;
- Discusses factors that contribute to roadway to congestion; and
- Quantifies the relative contributions of different factors, including population, employment, road network changes and TNCs, to observed changes in congestion in San Francisco between 2010 and 2016, by location and time of day.
The report utilizes a unique TNC trip dataset provided to the Transportation Authority by researchers from Northeastern University in late 2016, as well as INRIX data, a commercial dataset which combines several real-time GPS monitoring sources with data from highway performance monitoring systems. These data are augmented with information on network changes, population changes, and employment changes provided by local and regional planning agencies, which are used as input to the Transportation Authority’s activity-based regional travel demand model SF-CHAMP.
DO TNCs AFFECT CONGESTION?
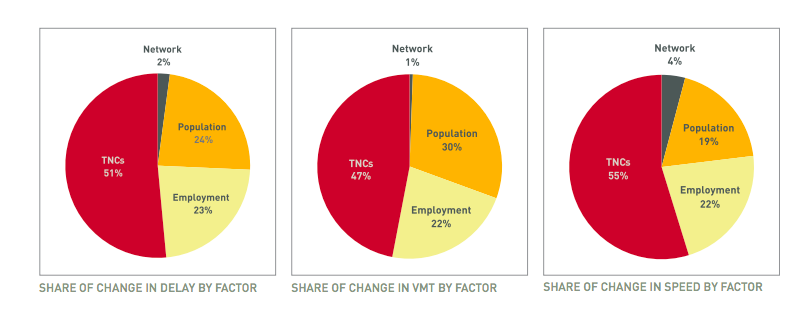
Yes. When compared to employment and population growth and network capacity shifts (such as for a bus or bicycle lane), TNCs accounted for approximately 50% of the change in congestion in San Francisco between 2010 and 2016, as indicated by three congestion measures: vehicle hours of delay, vehicle miles travelled, and average speeds. Employment and population growth—encompassing citywide non-TNC driving activity by residents, local and regional workers, and visitors—are primarily responsible for the remainder of the change in congestion.
- Daily vehicle hours of delay (VHD) on the roadways studied increased by about 40,000 hours during the study period. We estimate TNCs account for 51% of this increase in delay, and for about 25% of the total delay on San Francisco roadways and about 36% of total delay in the downtown core in 2016, with employment and population growth accounting for most of the balance of the increased in delay.
- Daily vehicle miles travelled (VMT) on study roadways increased by over 630,000 miles. We estimate TNCs account for 47% of this increase in VMT, and for about 5% of total VMT on study roadways in 2016.
- Average speeds on study roadways declined by about 3.1 miles per hour. We estimate TNCs account for 55% of this decline.
WHEN DO TNCS AFFECT CONGESTION?
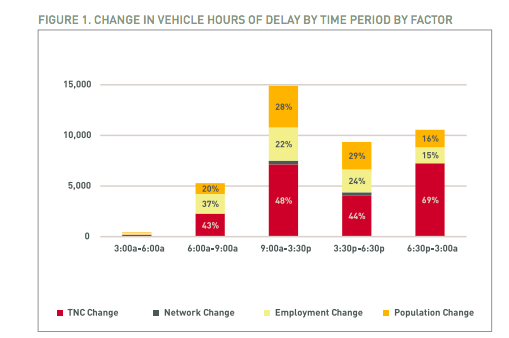
During the AM peak, midday, and PM peak periods, TNCs cause between 43% and 48% of the increased delay and account for about 20% of total delay during these time periods. Employment growth and population growth combined account for just over half of the increased delay. In the evening time period, TNCs are responsible for 69% of the increased delay, and for about 40% of the total delay.
Similarly, during the AM peak, midday, and PM peak periods, TNCs cause about 40% of the increased vehicle miles travelled, while employment and population growth combined are responsible for about 60% of the increased VMT. However, in the evening time period, TNCs are responsible for over 61% of the increased VMT and for about 9% of total VMT.
TNCs are responsible for about 45%-55% of the decline in average speed during most times of day, and are responsible for 75% of the declines in speed during the evening time period.
Download full version (PDF): TNCs & Congestion
About the San Francisco County Transportation Authority
www.sfcta.org
Guided by principles of accountability and transparency, the mission of the San Francisco County Transportation Authority is to provide financial strategy, planning expertise and project delivery and oversight, to help create a better city through improved mobility.
Tags: Congestion Management Agency, Lyft, San Francisco, San Francisco County Transportation Authority, SFCTA, TNC, Transportation Network Companies, Uber
 RSS Feed
 & Congestion)