


AMERICAN LUNG ASSOCIATION
The “State of the Air 2018” found ozone pollution worsened significantly in 2014- 2016 compared to the previous report, while improvements continued in year-round particle pollution and fewer episodes of high particle days. This year’s report provides continued evidence that the United States must continue to fight climate change and to support and enforce the Clean Air Act to protect the nation from unhealthy air.
The State of the Air 2018 report shows that many cities across the nation experienced more days when ground-level ozone, also known as “smog,” reached unhealthy levels, including most of the cities with the worst ozone problems. Fortunately, most cities continued to reduce their burden of year-round particle pollution, and fewer cities suffered from more spikes in particle pollution, often called “soot.”
The “State of the Air 2018” report adds to the evidence that a changing climate is making it harder to protect human health. With record-setting heat in 2016, high ozone days zoomed, putting millions more people at risk and adding challenges to the work cities are doing across the nation to clean up.
The Clean Air Act must remain intact and enforced to enable the nation to continue to protect all Americans from the dangers of air pollution. This law has driven improvements in air quality for 48 years, improvements that the State of the Air 2018 continues to document. The nation must ensure that the Clean Air Act’s tools remain in place, funded and followed.
The “State of the Air 2018” report looks at levels of ozone and particle pollution found in official monitoring sites across the United States in 2014, 2015 and 2016. The report uses the most current quality-assured nationwide data available for these analyses.
The report examines particle pollution (PM2.5) in two separate ways: averaged yearround (annual average) and over short-term levels (24-hour). For both ozone and short-term particle pollution, the analysis uses a weighted-average number of days that allows recognition of places with higher levels of pollution. For the year-round particle pollution rankings, the report uses averages calculated and reported by the U.S. Environmental Protection Agency (EPA). For comparison, the “State of the Air 2017” report covered data from 2013, 2014 and 2015.
Overall Trends
The “State of the Air 2018” found ozone pollution significantly worsened in 2014- 2016, while improvements continued in year-round particle pollution and fewer episodes of high particle days. The number of people exposed to unhealthy levels of air pollution increased to more than 133.9 million people, higher than the 125 million in the years covered by the 2017 report (2013-2015).
The spike in ozone demonstrates the public health impact of increased temperatures from the changing climate on the nation’s air quality. With 2016 marking the second warmest year on record, the higher temperatures provided fuel to increase the formation of ozone from the still under-controlled emissions of the precursor emissions.
The best progress came in the continued reduction of year-round particle pollution, thanks to cleaner power plants and increased use of cleaner vehicles and engines. Continued progress to cleaner air remains crucial to reduce the risk of premature death, More than four in 10 asthma attacks and lung cancer.
More than four in 10 people (41 percent) in the United States live in counties that have unhealthful levels of either ozone or particle pollution. More than 133.9 million people live in the 215 counties that had unhealthy ozone or particle pollution in 2014-2016.
Still, progress continues, thanks to the tools in the Clean Air Act. While this is a significant spike in areas with unhealthy levels of ozone and particle pollution, the number of people exposed to unhealthful air remains still far below the 166 million in the years covered in the 2016 report (2012-2014).
More than 7.7 million people (2.4 percent) live in 10 counties with unhealthful levels of all three: ozone and short-term and year-round particle pollution. This is 10.4 million fewer people than in the 2017 report, but also likely undercounts the number due to missing data. This year, two heavily populated counties in California—San Bernardino County and Los Angeles County—lacked year-round particle-pollution data. Had data been available from those two counties, which traditionally have unhealthful levels of all three measures, the actual number would likely be much higher, likely 19 million people. Furthermore, valid data remain missing on particle pollution in all of Illinois, as has been the case since the 2014 report covering 2010-2012.
Los Angeles remains the city with the worst ozone pollution as it has for nearly the entire history of the report. Fairbanks, AK, moved for the first time into the most polluted slot for year-round particle pollution, while Bakersfield, CA, maintains its rank as the city with the worst short-term particle pollution.
Despite the increase in ozone, the “State of the Air 2018” report shows that actions taken under the Clean Air Act continue to clean up pollution in much of the nation, as it nearly completes its fifth decade of service. Many cities reported lower levels of year-round particle pollution, and many cities reached or remained close to their cleanest years ever.
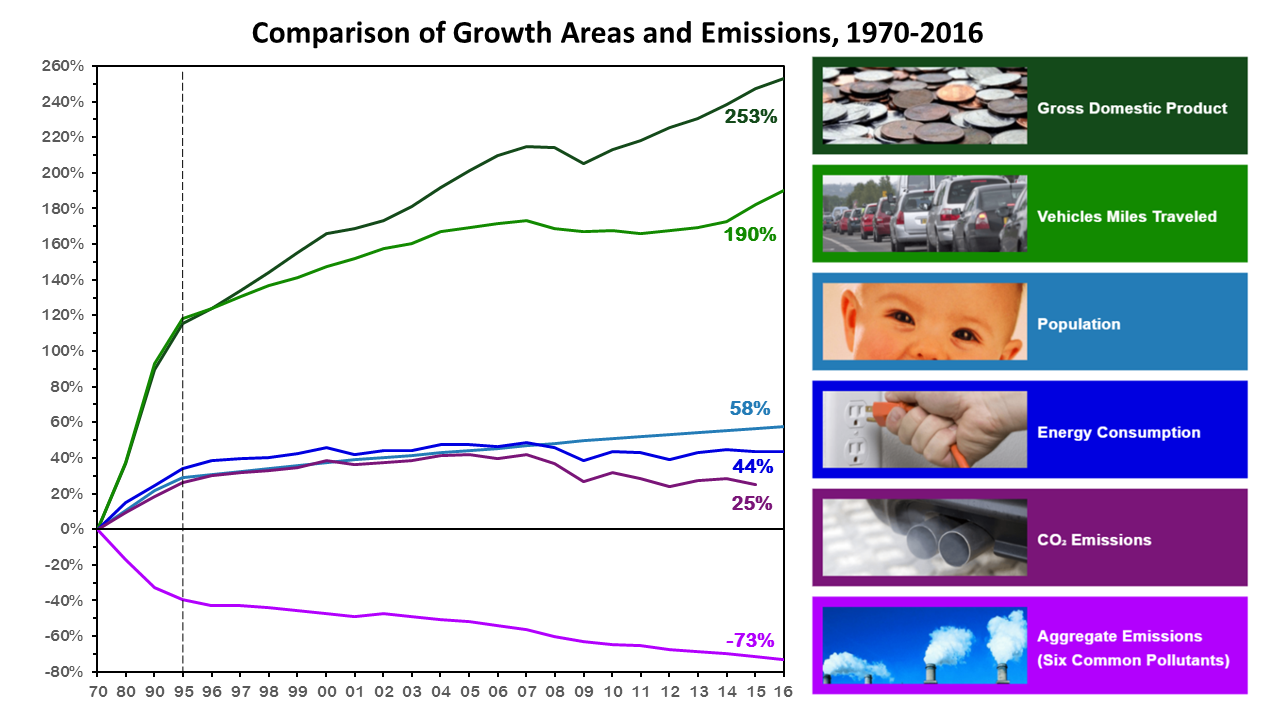
Thanks to the provisions in the Clean Air Act, the United States has continued to reduce ozone and particle pollution as well as other pollutants for decades. Figure 1 from EPA shows that, since 1970, the air has gotten cleaner while the population, the economy, energy use and miles driven increased greatly. As the economy continues to grow, overall air emissions that create the six most-widespread pollutants continue to drop.
The “State of the Air 2018” report shows, again, that climate change makes it harder to protect human health. This year’s report shows the spike in high ozone days; in last year’s report, the spikes came in unhealthy particle-pollution episodes driven by wildfires. While most of the nation has much cleaner air quality than even a decade ago, too many cities suffered increased ozone from the increased temperature and continued high particle pollution from wildfires driven by changing rain patterns.
As climate change continues, cleaning up these pollutants will become ever more challenging. Climate change poses many threats to human health, including worsened air quality and extreme weather events. The nation must work to reduce emissions that worsen climate.
The Clean Air Act must remain intact and enforced to enable the nation to continue to protect all Americans from the dangers of air pollution. At its core, the Clean Air Act protects public health and has driven improvements in air quality for 48 years, as shown in Figure 1. Since 2000, the “State of the Air” reports have also documented these improvements, as shown in trend charts for counties and cities available at www. stateoftheair.org. That progress is not certain to continue, as some in Congress seek to remove or weaken that law, and as the administration seeks to repeal or reverse the safeguards in place to enforce the law.
Download full version (PDF): The State of the Air 2018
About the American Lung Association
www.lung.org
“For more than a century, the American Lung Association has led the fight for healthy lungs and healthy air. Today, we are focused on eliminating tobacco use and related lung disease, improving overall air quality for all and reducing the burden of lung disease on patients and their families.”
Tags: American Lung Association, Clean Air Act, Ozone, Particle Pollutants, State fo the Air, State of the Air 2018
 RSS Feed