


NYU RUDIN CENTER FOR TRANSPORTATION
Introduction
Women report day-to-day experiences of harassment, catcalling and general discomfort, much of it on transportation systems, affecting their sense of safety and self-worth. This report, prepared by the NYU Rudin Center for Transportation, is based on an online survey of New Yorkers conducted in September-October, 2018.
The term “woman” is inclusive of all female forms, including cis, trans and female-presenting.
The Pink Tax
The Pink Tax is a form of gender-based price discrimination. It is the extra amount that women pay for certain products, such as deodorant, and services, including dry cleaning. A study conducted by the New York City Department of Consumer Affairs found that on average, women’s products cost 7% more than similar products for men .
This report seeks to determine whether and how the Pink Tax applies to Transportation in New York City.
Survey
To learn more about women’s experiences while traversing New York City, the NYU Rudin Center for Transportation deployed a survey, which was shared online at SurveyMonkey for approximately six weeks during September and early October, 2018.
The survey’s 33 questions asked users about travel habits, safety on transportation, costs of travel, caretaker trips, and demographic information. The survey did not request any personally identifiable information.
There were 547 complete survey responses. The following map (Figure 1) shows the geographic distribution of survey responses, based on a question asking respondents for their home ZIP code. Note that there were several responses in outlying areas that are not shown on the map—the map provides detailed response information for the New York City area only. The following graphs (Figures 2, 3, & 4) provide a demographic profile of the survey respondents.
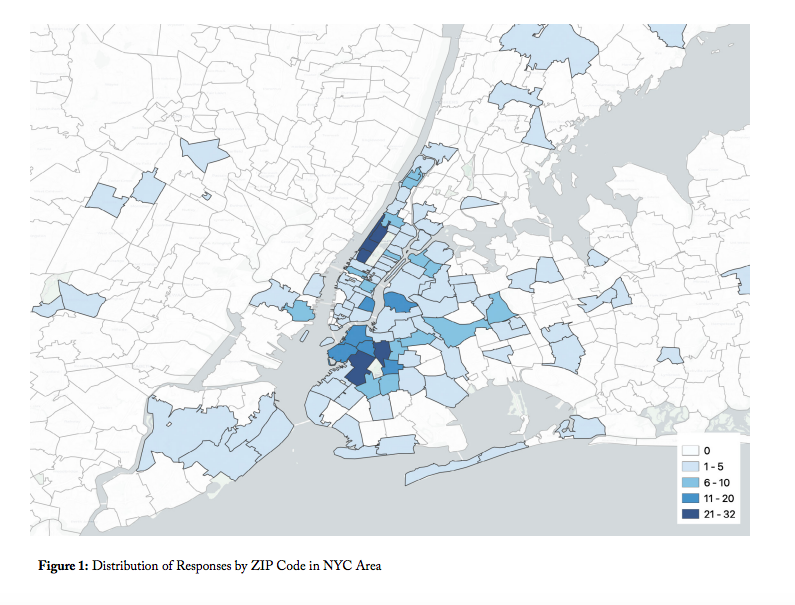 The survey respondents consist of a subset of the NYC population, one that is not entirely representative of the entire city’s residents. They include primarily college educated individuals—93.4% have a college degree or higher—and are geographically concentrated in specific areas of the city, including the Upper West Side of Manhattan. This is reflected in the subway line ridership results, which show unusually high ridership along the 1 line. Detailed results of the survey are presented in the following sections.
Question 4 asked respondents which subway line they take the most frequently. The results are shown in Figure 5 on page 4.
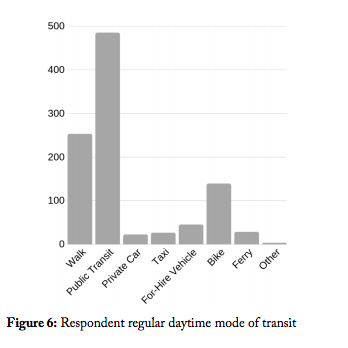
In order to understand the types of users participating in the survey, Question 2 of the survey asked, “What is your regular mode of transit during the day (6 a.m. – 8 p.m.), such as to your place of work or school? (Select all that apply).” The results are shown in Figure 6 on page 4. Upwards of 89% of survey respondents regularly use public transportation. Respondents who use walking, public transit, private car, and ferry as primary modes are evenly split by gender. However, 77% of taxi users are female, 73% of for-hire vehicle users are female, and 67% of bike users are male.
Safety on Public Transportation
According to the survey results, 75% of female respondents have experienced some form of harassment or theft while using public transportation. By contrast, 47% of male respondents indicated that they have experienced harassment or theft while using public transportation. Approximately 86% of harassment incidents occur on the subway system, of which 76% occur on the trains (as opposed to on the platform or turnstile area). Most incidents occurred during rush hour (38%), when trains are crowded, as opposed to late night or off-peak hours.
Question 17 asked respondents how many times they had experienced harassment. Most respondents had trouble quantifying the exact number and provided answers like, “Too many to count,” “Not sure – it’s taken place over my entire life,” and “Countless.”
88% of those who have experienced harassment
did not report the incident to authorities.
Several respondents shared the sentiment that reporting the incident would have no effect. One respondent explained, “I didn’t bother because I didn’t think they would do anything.” Another respondent answered, “The notion of reporting everyday harassment to the authorities is bizarre to me. What would they do?”
For those respondents who did report to authorities, a follow-up question asked respondents about the outcome. One respondent answered, “After waiting in line to speak with the person in the booth, a train passed through the station, so I was told the person who harassed me had probably already left and it wasn’t worth calling the police. I then took a cab home.” Another summarized the outcome of many investigations: “they did nothing.”
Perceptions of Safety
More than half (54%) of female respondents are concerned about being harassed while using public transportation, compared to only 20% of male respondents.
For late night travel, most respondents feel safest using for-hire vehicles (42%), followed by taxis (16%), and then public transportation (15%).
Conclusion: These real and perceived threats have a notable impact
on transit users’ opinions of safety on public transportation.
However, more frequent subway users are more likely to feel safe on public transportation late at night. Of those who use the subway several times per week, 17% feel safest using public transportation, while no respondent who uses the subway less than once per month said they feel safest on public transportation during late nights.
Almost half (49%) of frequent (multiple trips per week) subway users have experienced harassment compared to 34% for less frequent, monthly subway users.
Conclusion: More frequent users of public transportation are more likely
to have experienced harassment or theft.
Approximately 13% of female respondents said they dress differently, and 29% do not take public transportation late at night as a result of a perceived safety threat. In comparison, only 3% of male respondents dress differently and 8% do not take public transportation late at night for the same reason.
Conclusion: Women are more likely than men to change
their behavior in order to avoid harassment.
The results of the survey conclude that using alternative modes of transportation at night for safety reasons adds to monthly travel expenses for women.
The median extra cost per month for men, due to safety reasons, is $0.
On the other hand, the median extra cost per month for women is $26-$50.
Download full version (PDF): The Pink Tax on Transportation
About the New York University Rudin Center for Transportation
wagner.nyu.edu/rudincenter
The Rudin Center for Transportation Policy and Management at NYU’s Wagner school explores challenges in transportation and infrastructure. The Center draws upon faculty and graduate students to conduct research on cities and mobility, information technology in transportation and access to mass transit.
Tags: MTA, NYC, NYU Rudin Center for Transportation, pink tax, Rudin Center, Subway
 RSS Feed