TRANSPORTATION FOR AMERICA
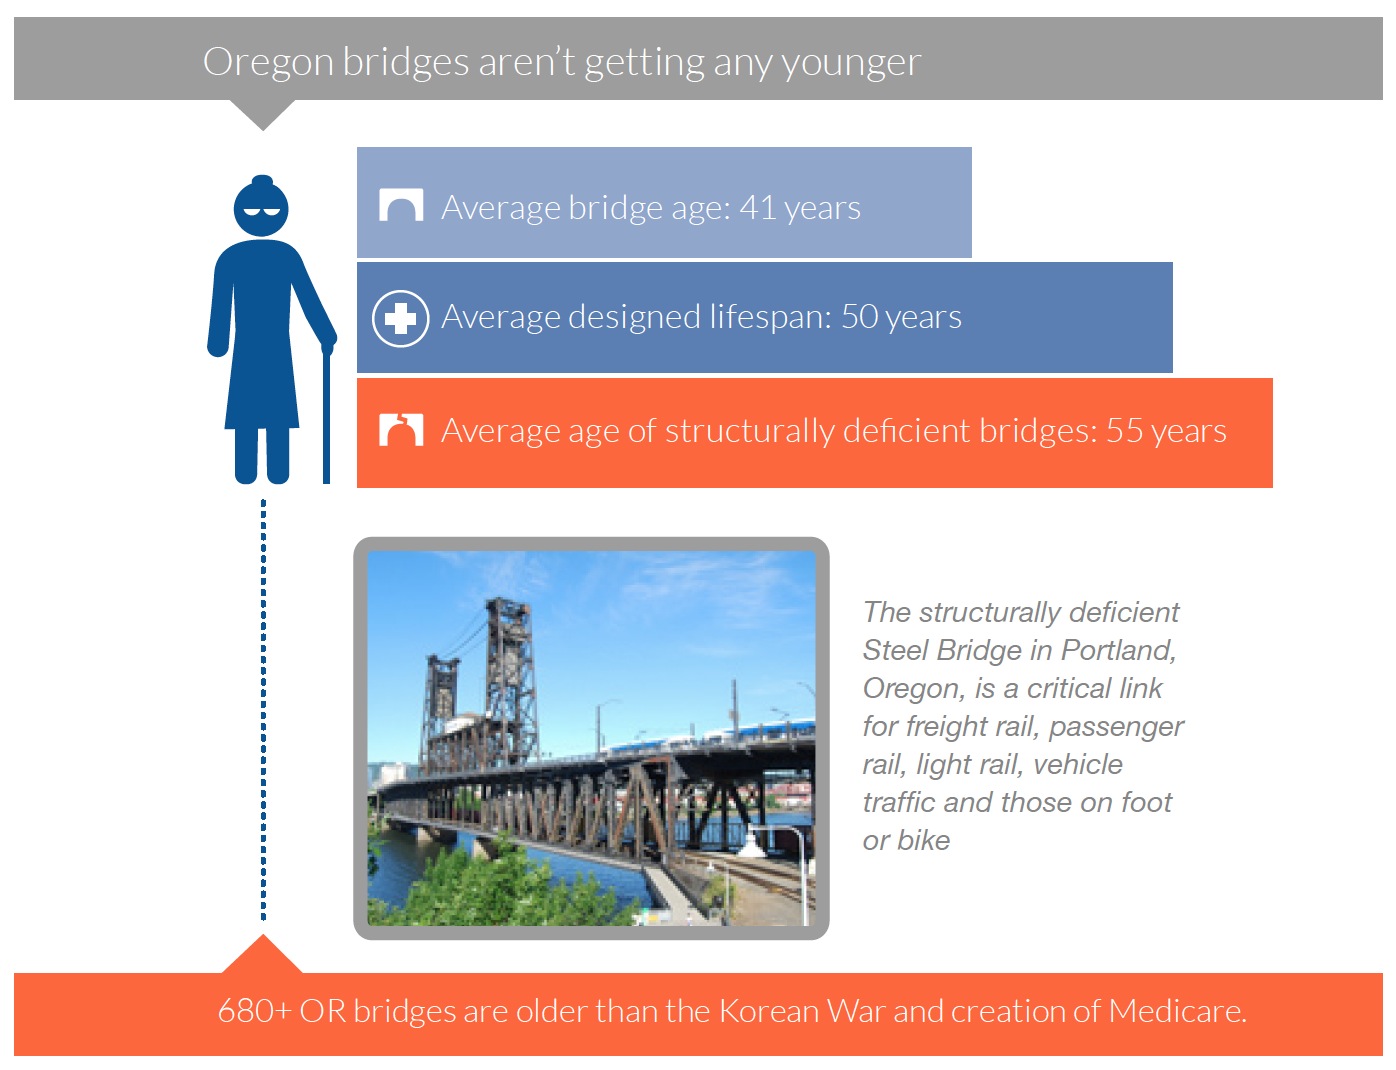
The average age of these sub-par bridges is 55 years — over the typical design life of 50 years and 14 years older than the average age of all Oregon bridges (41 years old). More than one in twelve Oregon bridges were built before 1948 — which means more than 680 bridges are older than the Korean War and creation of Medicare.
Posts Tagged ‘T4America’
The State of Oregon’s Bridges
Monday, June 15th, 2015The State of Minnesota’s Bridges
Wednesday, May 6th, 2015TRANSPORTATION FOR AMERICA
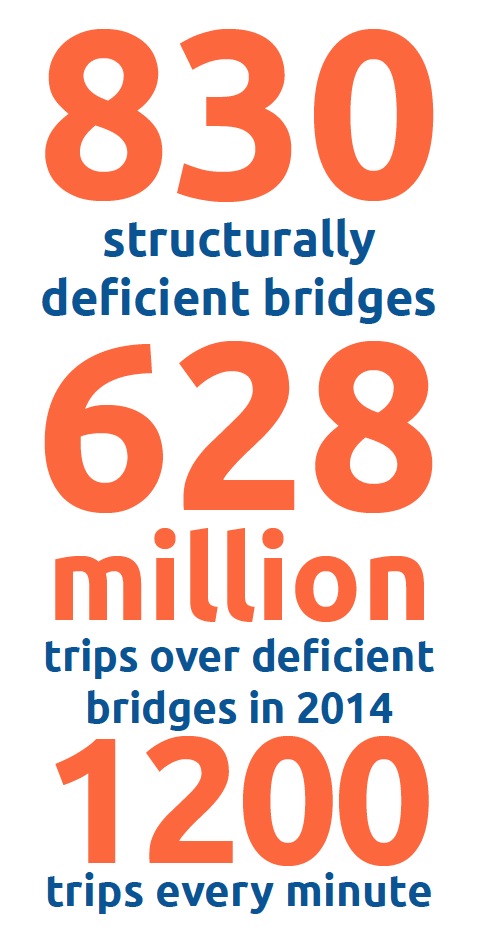
The average age of these sub-par bridges is 66 years — well over the typical design life of 50 years and nearly double the average age of all Minnesota bridges (35 years old). More than one in ten Minnesota bridges were built before 1948 — which means more than 1,300 bridges are older than the Korean War and creation of Medicare…Minnesota drivers collectively took close to 628 million trips over deficient bridges in 2014. That’s more than 1.7 million trips per day or almost 1,200 trips every minute taken over deficient Minnesota bridges in 2014.
Measuring What We Value: Setting Priorities and Evaluating Success in Transportation
Tuesday, March 10th, 2015TRANSPORTATION FOR AMERICA
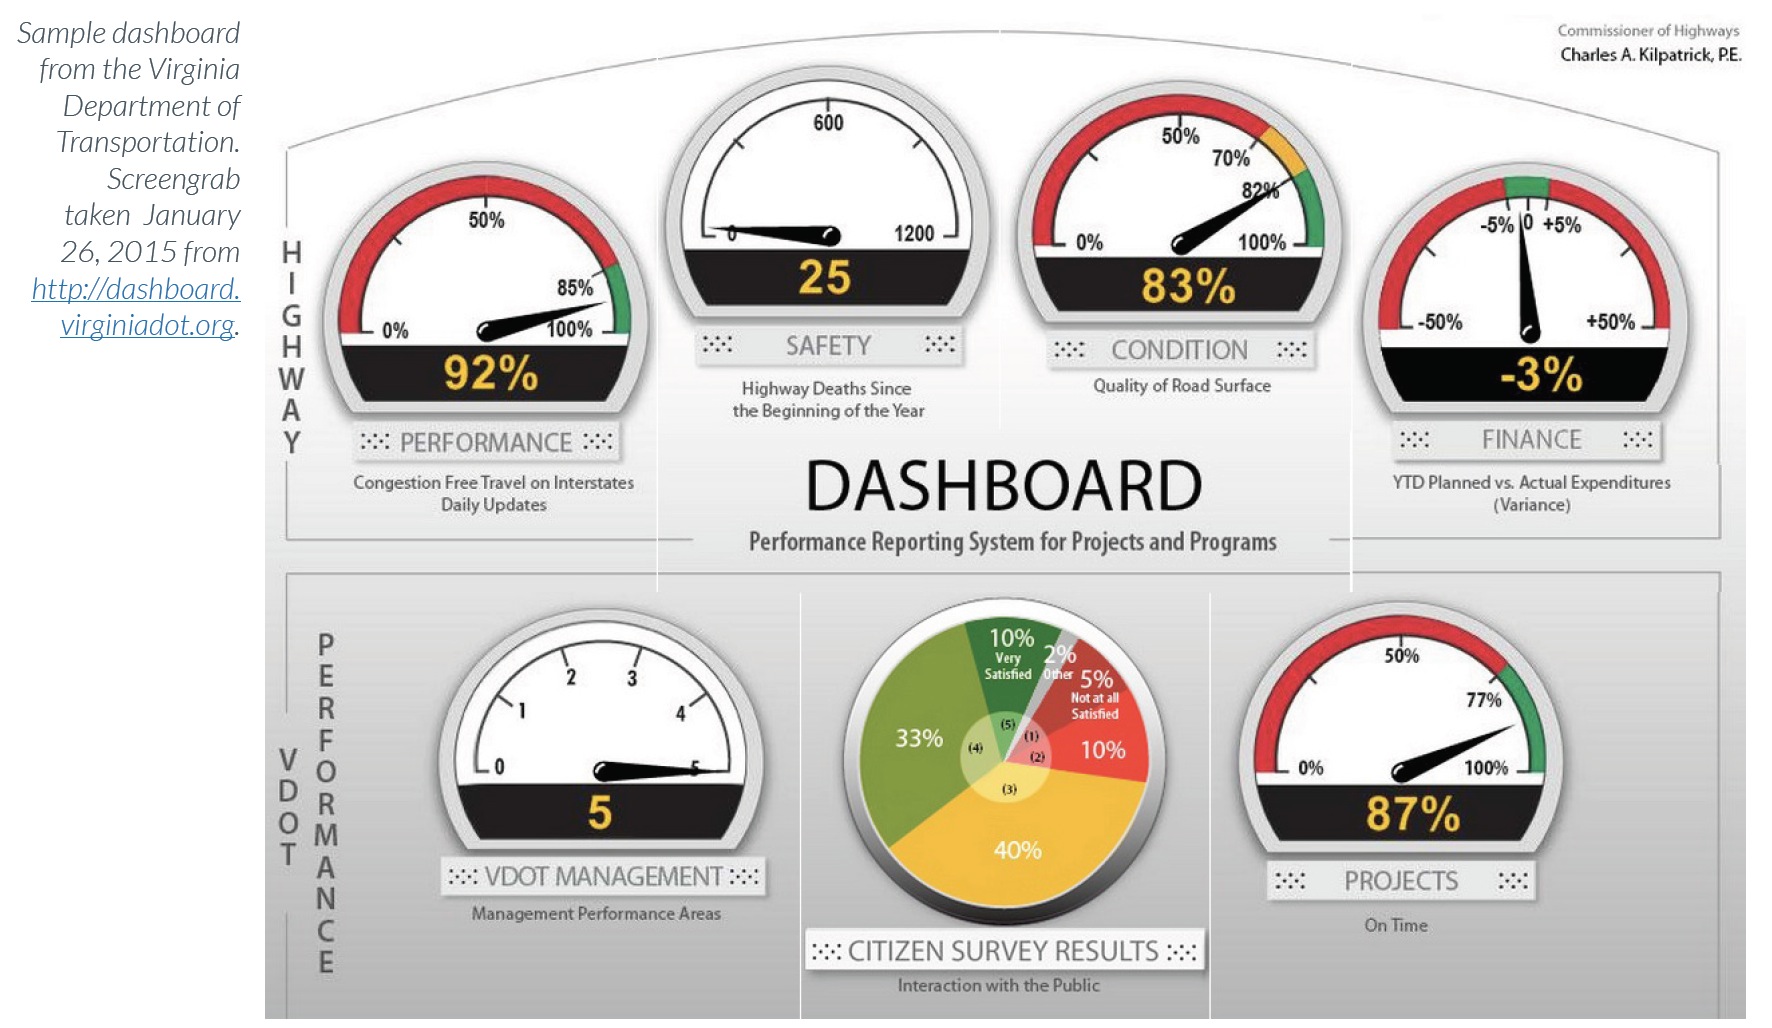
Over the past 50 years, transportation agencies have focused on tracking a narrow set of goals — typically system condition, safety and sometimes traffic congestion. While these goals are important, they measure the state of the transportation system, not the impact of the system on people’s lives. People want to know that transportation funds are being spent in a way that creates value, supports long-term job growth, makes their communities more attractive to business and talent and will contribute to their economic health and resilience.
Capital Ideas: Winning State Funding for Transportation
Tuesday, February 17th, 2015TRANSPORTATION FOR AMERICA
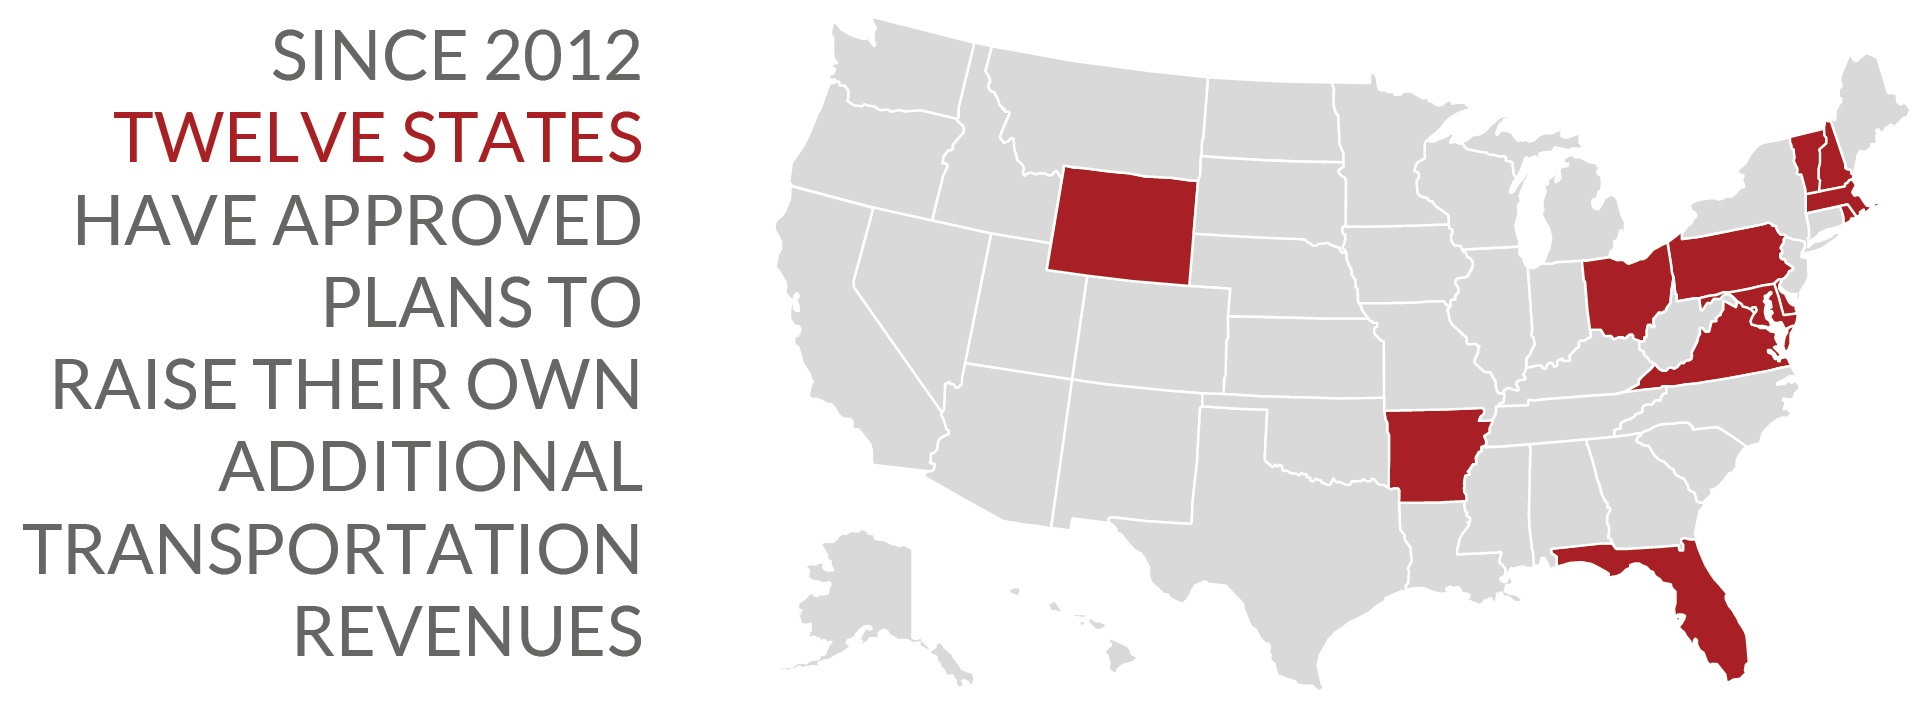
Transportation for America has closely followed efforts in legislatures across the country to put transportation funding on sound footing. This report highlights critical factors common to many of the campaigns and closely examines several successful campaigns. Learning successful strategies and tactics from other states can be a valuable way for advocates, legislators, and local leaders to build winning campaigns in their own states.
The Fix We’re In For: The State of Our Nation’s Bridges 2013
Wednesday, June 26th, 2013TRANSPORTATION FOR AMERICA One in nine bridges remains structurally deficient. Every day, millions of people from all walks of life in cities and towns large and small travel over one of our country’s 66,405 structurally deficient bridges — more than one in nine (11 percent) of all bridges. Structurally deficient bridges are those that require […]
View this complete post...After the Dust Has Settled… Some Reflections on the New Transportation Law (MAP-21) Update
Wednesday, July 18th, 2012Innovation NewsBriefsVol. 23, No. 21 (Rev) By a vote of 373-52 in the House and a vote of 74-19 in the Senate, the lawmakers approved a two year reauthorization (October 1, 2012 through September 30, 2014) of the federal surface transportation program, just one day before the program was set to expire on June 30. […]
View this complete post...Newly approved transportation bill is a clear step backwards — a message from T4 America
Monday, July 2nd, 2012TRANSPORTATION FOR AMERICA
Written by: Stephen Lee Davis
More than 1,000 days after the last transportation bill expired, Congress finally voted to approve a new transportation bill just moments ago. Unfortunately for those hoping for a bold step into the future, this bill represents a definite step backwards, the last gasp of an outdated 20th century program.
Transportation For America: Oppose House Bill
Tuesday, February 7th, 2012From Transportation For America: Friday was a shocking day in the House of Representatives. A House committee majority went ahead with their plan to punish everyone who rides public transportation, as well as jeopardizing thousands of jobs in the public transit, construction and manufacturing industries. In doing this, House leadership and this committee ignored broad, […]
View this complete post...More Broken Bridges Than Golden Arches [INFOGRAPHIC]
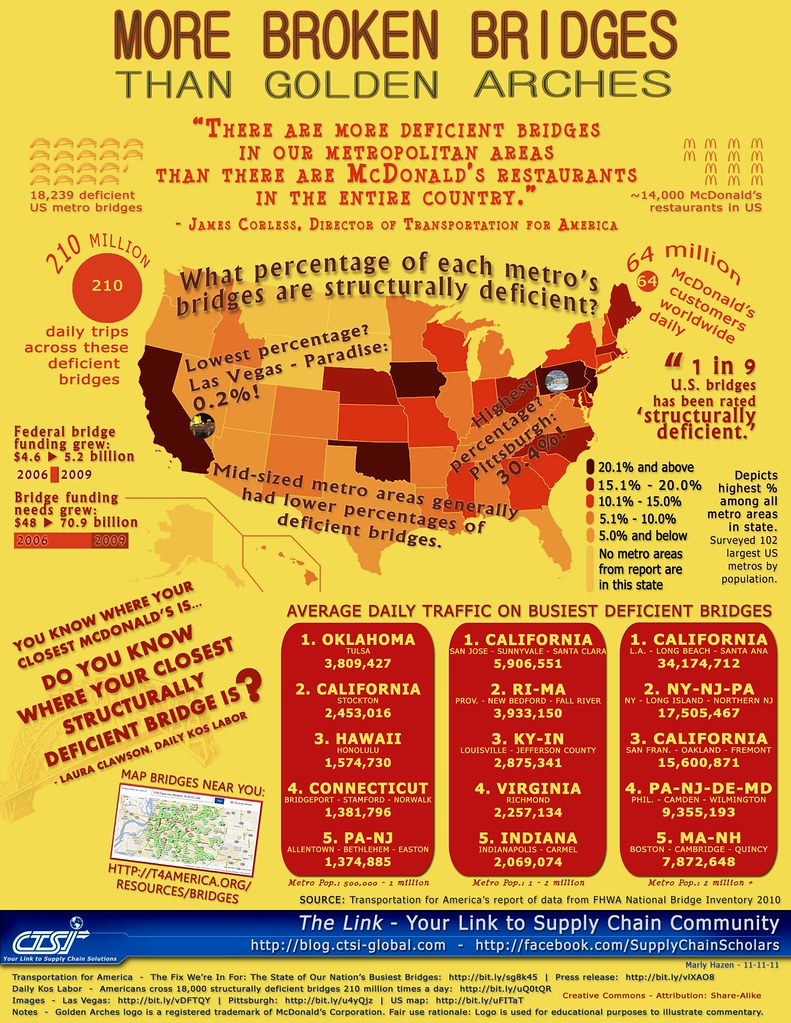
Monday, November 14th, 2011“There are more deficient bridges in our metropolitan areas than there are McDonald’s restaurants in the entire country,” reported Transportation for America.
View this complete post...The Fix We’re In For: The State of Our Nation’s Bridges – Metropolitan Bridge Rankings
Wednesday, October 19th, 2011TRANSPORTATION FOR AMERICA
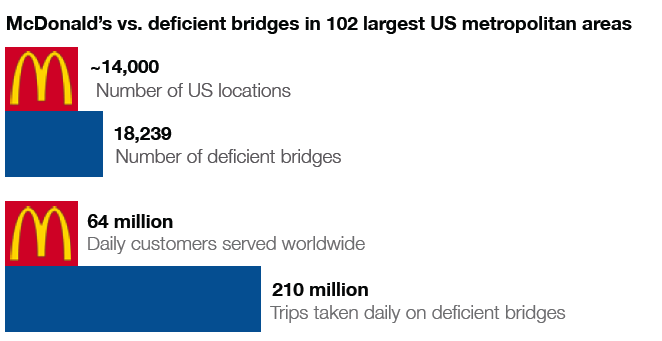
Structurally deficient bridges in metropolitan areas carry a disproportionate share of all trips taken on a deficient bridge each day. In fact, deficient bridges in the largest 102 metropolitan areas carry three-quarters of all traffic crossing a deficient bridge. Put another way, there are more deficient bridges in these 102 regions than there are McDonald’s restaurants in the entire country – 18,239 versus about million 14,000. Worldwide, McDonald’s serves a staggering 64 million people a day. But here in America, 210 million trips are taken daily across deficient bridges in just these 102 regions.
Follow InfrastructureUSA
CATEGORIES
- Accountability (219)
- Aging Infrastructure (752)
- Aviation (130)
- Biking (323)
- Bipartisan (271)
- Bridges (493)
- Broadband (57)
- Buses (160)
- Carbon Tax (22)
- Clean Air (182)
- Climate Change (200)
- Competitiveness (230)
- Congestion (327)
- Dams (77)
- Democrat (123)
- Drinking Water (191)
- Economic Stimulus (276)
- Employment (207)
- Energy (585)
- Environment (615)
- Equity (239)
- Funding (887)
- Global (205)
- Great American Infrastructure (33)
- Green (294)
- Guests on The Infra Blog (274)
- Hazardous Waste (27)
- High Speed Rail (224)
- Highway (785)
- Inland Waterways (204)
- Jobs (251)
- Land Use (98)
- LEED (28)
- Levees (42)
- Local (1,910)
- National (1,525)
- Policy (1,121)
- Pollution (215)
- Private Investment (213)
- Public Opinion (189)
- Public Parks & Recreation (196)
- Public Transportation (1,028)
- Racism (6)
- Rail (502)
- Recession (65)
- Recovery (218)
- Republican (109)
- Roads (1,120)
- Schools (80)
- Seaports (68)
- Smart Grid (98)
- Smart Growth (442)
- Solid Waste (26)
- Sustainability (765)
- Tax (112)
- Technology (397)
- Telecommunications (46)
- Transit (1,333)
- Urban Planning (979)
- Wastewater (180)
- Water Treatment (165)
Video, stills and tales. Share images of the Infra in your community that demands attention. Post your ideas about national Infra issues. Go ahead. Show Us Your Infra! Upload and instantly share your message.
Is the administration moving fast enough on Infra issues? Are Americans prepared to pay more taxes for repairs? Should job creation be the guiding determination? Vote now!
What do the experts think? This is where the nation's public policy organizations, trade associations and think tanks weigh in with analysis on Infra issues. Tell them what you think. Ask questions. Share a different view.
The Infra Blog offers cutting edge perspective on a broad spectrum of Infra topics. Frequent updates and provocative posts highlight hot button topics -- essential ingredients of a national Infra dialogue.
Dear Friends,
It is encouraging to finally see clear signs of federal action to support a comprehensive US infrastructure investment plan.
Now more than ever, our advocacy is needed to keep stakeholders informed and connected, and to hold politicians to their promises to finally fix our nation’s ailing infrastructure.
We have already engaged nearly 280,000 users, and hoping to add many more as interest continues to grow.
We require your support in order to rise to this occasion, to make the most of this opportunity. Please consider making a tax-deductible donation to InfrastructureUSA.org.
Steve Anderson
Managing Director
SteveAnderson@InfrastructureUSA.org
917-940-7125