U.S. DEPARTMENT OF TRANSPORTATION
BUREAU OF TRANSPORTATION STATISTICS
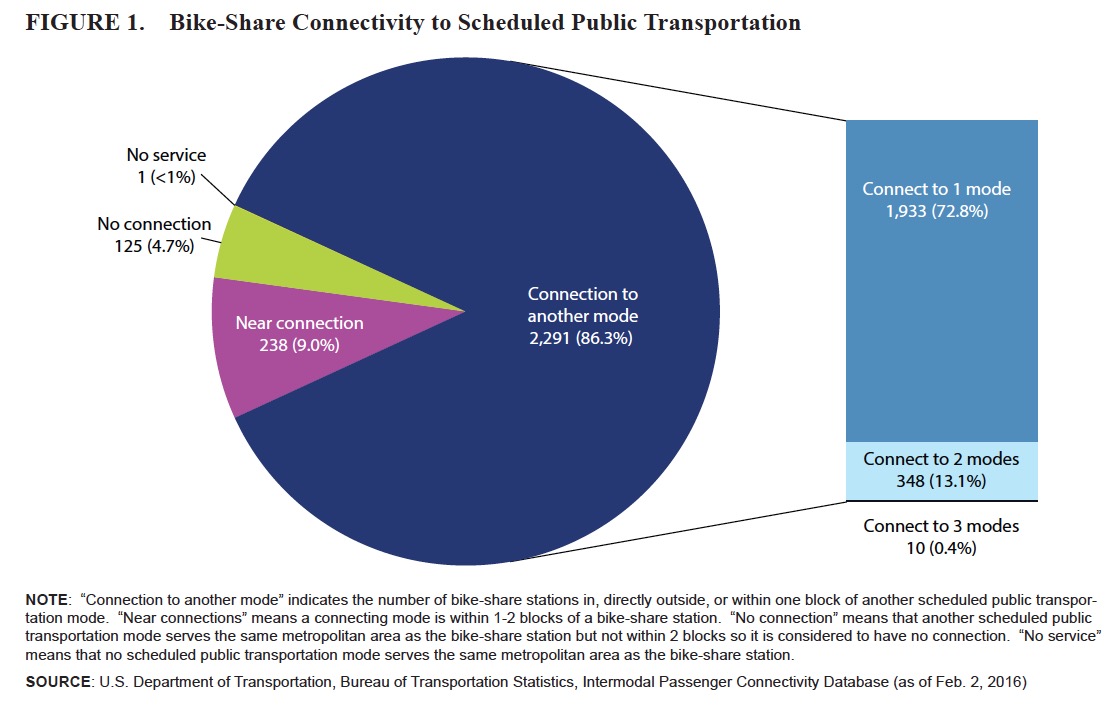
Bike-share systems typically operate independently of local transit authorities. However, most bike-share docking stations (86.3 percent) can be found near local public transportation stops (transit bus, commuter rail, heavy rail, light rail, and transit ferry). These locations offer modal choice and the opportunity to connect between modes. Transit bus is the most typical connection, with 84.2 percent (2,236) of bike-share stations located a block or less from a transit bus stop.
Posts Tagged ‘RITA’
Bike-Share Stations in the U.S.
Friday, April 8th, 2016State Transportation Statistics 2015
Tuesday, November 24th, 2015UNITED STATES DEPARTMENT OF TRANSPORTATION
BUREAU OF TRANSPORTATION STATISTICS
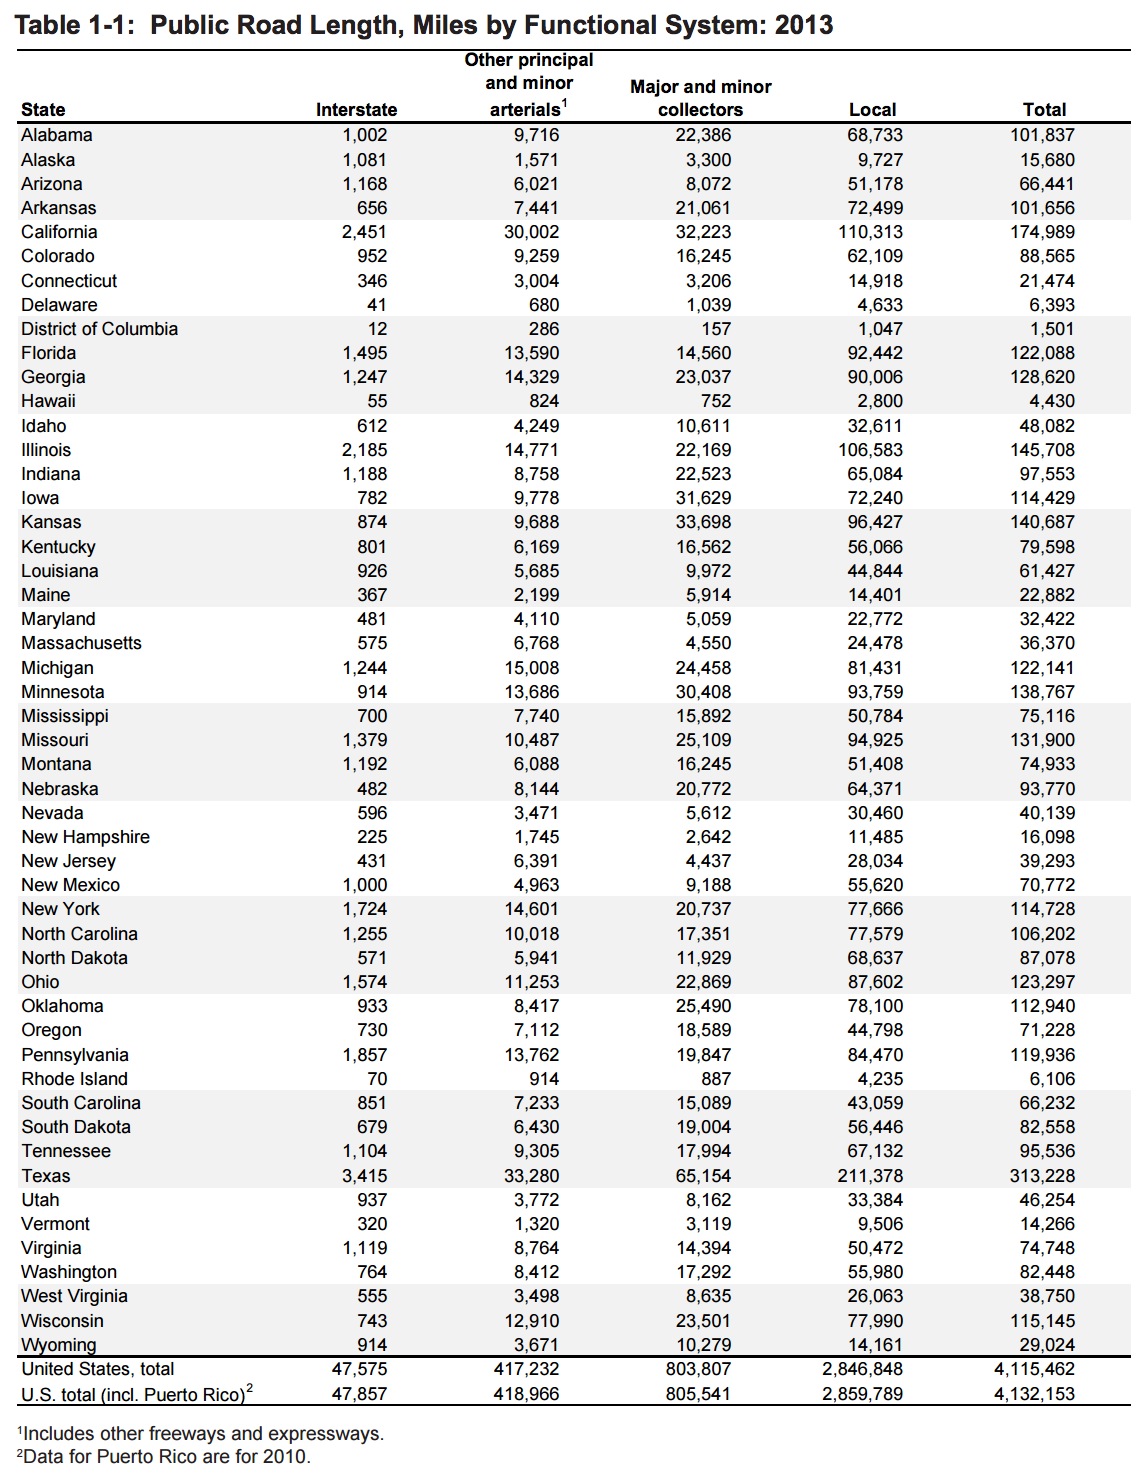
The State Transportation Statistics 2015 report contains comprehensive, quantitative data on the following topics: Infrastructure; Safety; Freight Transportation; Passenger Travel; Registered Vehicles and Vehicle-Miles Traveled; Economy and Finance; Energy and Environment
Transportation Statistics Annual Report
Friday, April 17th, 2015UNITED STATES DEPARTMENT OF TRANSPORTATION
BUREAU OF TRANSPORTATION STATISTICS
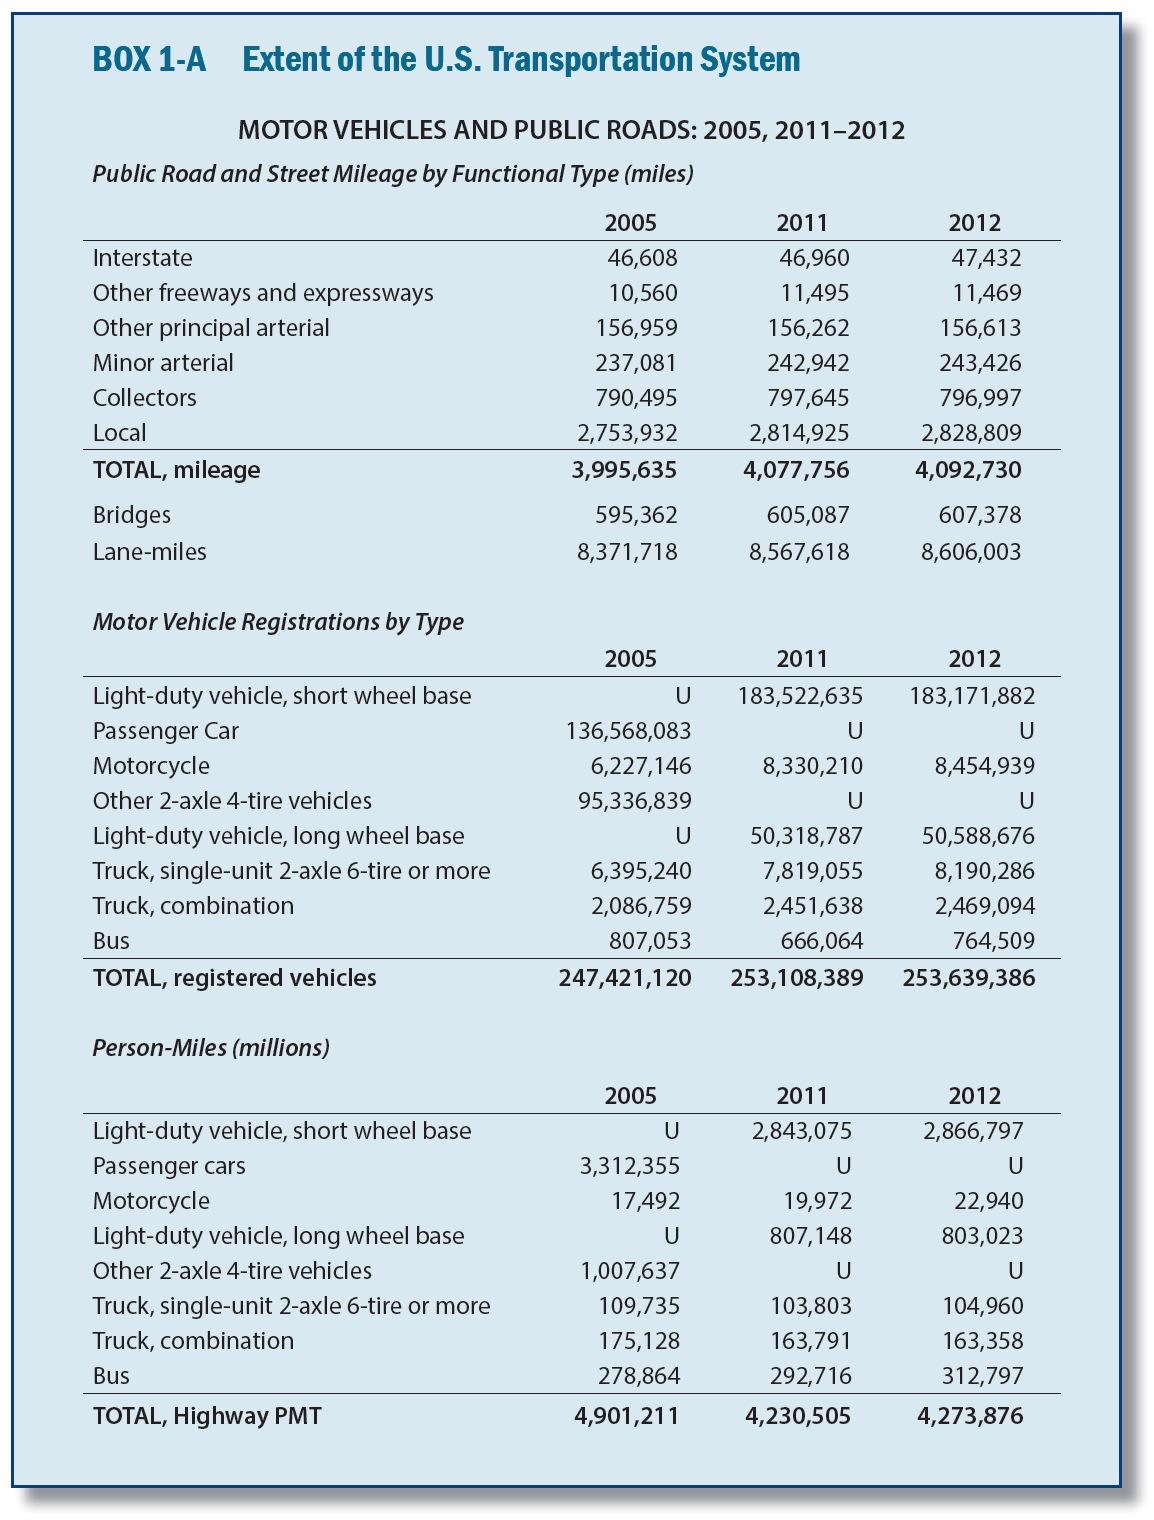
Over 4 million miles of roads, more than 19,000 public and private use airports, about 140,000 miles of freight and passenger railroads, 25,000 miles of navigable waterways, and 2 million miles of pipelines connect the Nation’s people and businesses across the continent and with the rest of the world…The estimated value of U.S. transportation assets in 2012 was $7.7 trillion. The public owns 51.2 percent of the total transportation asset value, mostly highways and streets, but also publicly held airports, waterways, and transit facilities. Private companies own 31.2 percent of transportation assets, including railroads, pipelines, trucks, planes, and ships.
Record Airline Traffic In 2014
Wednesday, April 1st, 2015UNITED STATES DEPARTMENT OF TRANSPORTATION
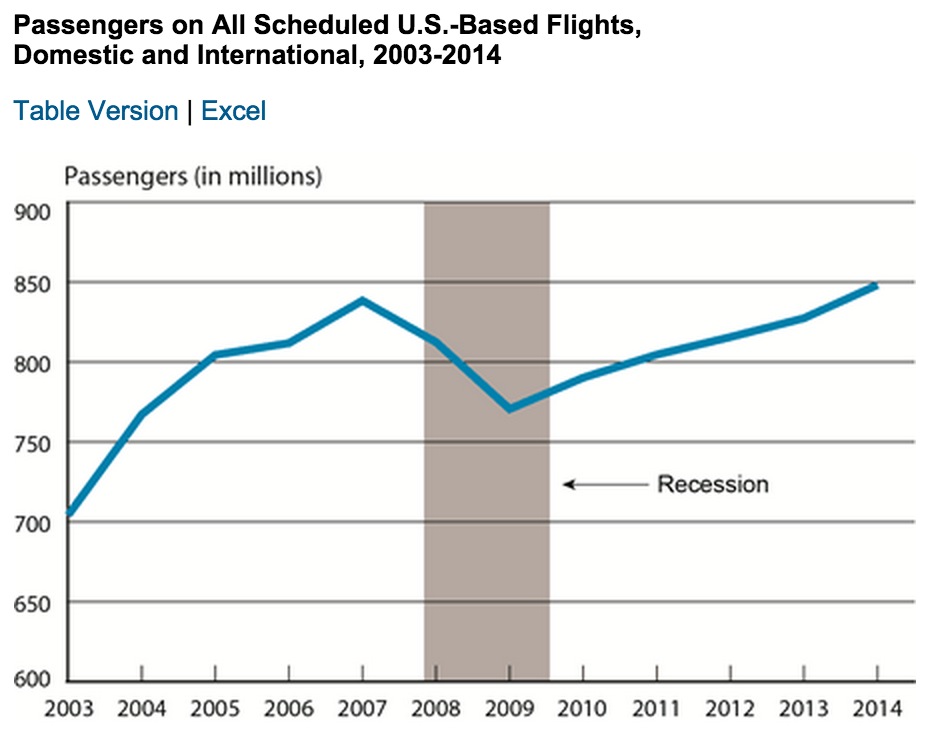
The U.S. Department of Transportation’s Bureau of Transportation Statistics (BTS) reported today that U.S. airlines and foreign airlines serving the United States carried an all-time high of 848.1 million systemwide (domestic and international) scheduled service passengers in 2014, 2.5 percent more than in 2013 and 1.2 percent more than the previous record-high of 838.4 million reached in 2007.
Spring 2014 Passenger Airline Employment Data
Thursday, May 22nd, 2014BUREAU OF TRANSPORTATION STATISTICS
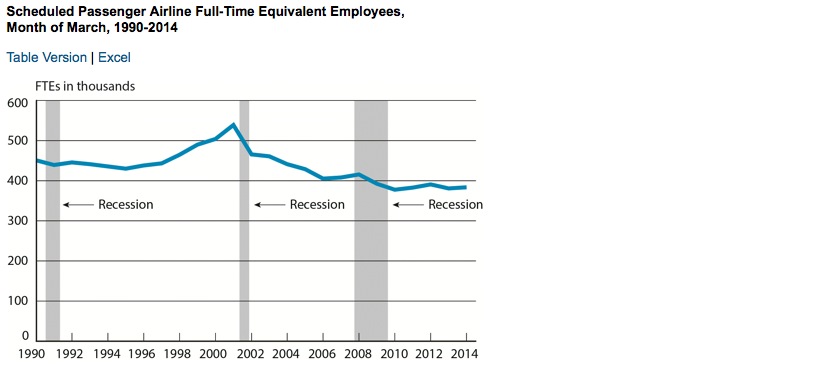
U.S. scheduled passenger airlines employed 383,610 workers in March 2014, 0.8 percent more than in March 2013, the U.S. Department of Transportation’s Bureau of Transportation Statistics (BTS) reported today. March was the fourth consecutive month that full-time equivalent (FTE) employment for U.S. scheduled passenger carriers was higher than the same month of the previous year (Tables 1, 2, 3).
Understanding Flight Delays
Monday, January 13th, 2014UNITED STATES DEPARTMENT OF TRANSPORTATION
OFFICE OF THE INSPECTOR GENERAL
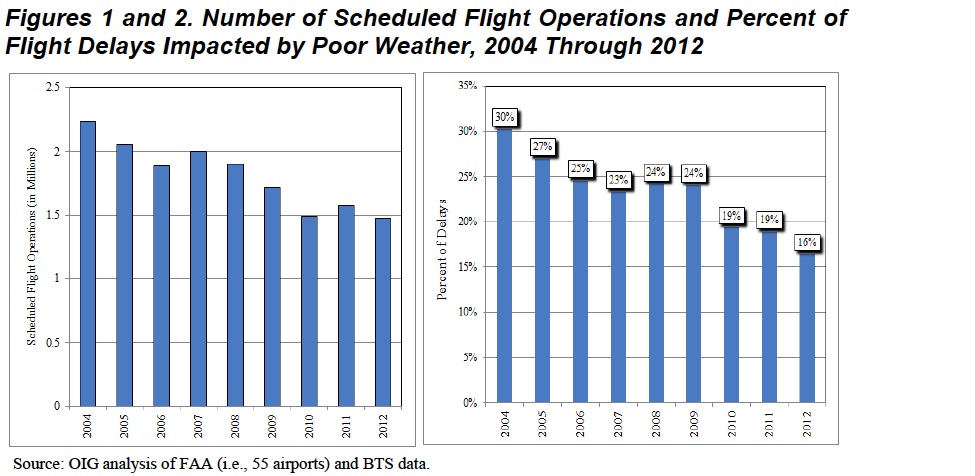
New infrastructure has helped reduce flight delays at many of the Nation’s busiest airports. Since 2000, 20 major airports previously designated by FAA as most critical to improving the capacity and efficiency of the National Airspace System (NAS) have completed substantial runway or taxiway projects that have served to increase capacity or improve traffic flows.
Guest on The Infra Blog: Dr. Camille Kamga, Director, University Transportation Research Center, City University of New York
Wednesday, November 6th, 2013“We really need to revamp our funding allocation process and develop outreach plans to engage more people. We must take advantage of the new technological tools to engage the younger generation, start talking about infrastructure at a younger age, in primary school, so people understand that infrastructure has a lifespan like any other organism. It has to live, it has to deteriorate, and if you don’t maintain it it’s going to die.”
View this complete post...Public Perceptions on Transportation Characteristics of Livable Communities: The 2009 Omnibus Household Survey
Tuesday, July 19th, 2011RESEARCH AND INNOVATIVE TECHNOLOGY ADMINISTRATION
BUREAU OF TRANSPORTATION STATISTICS
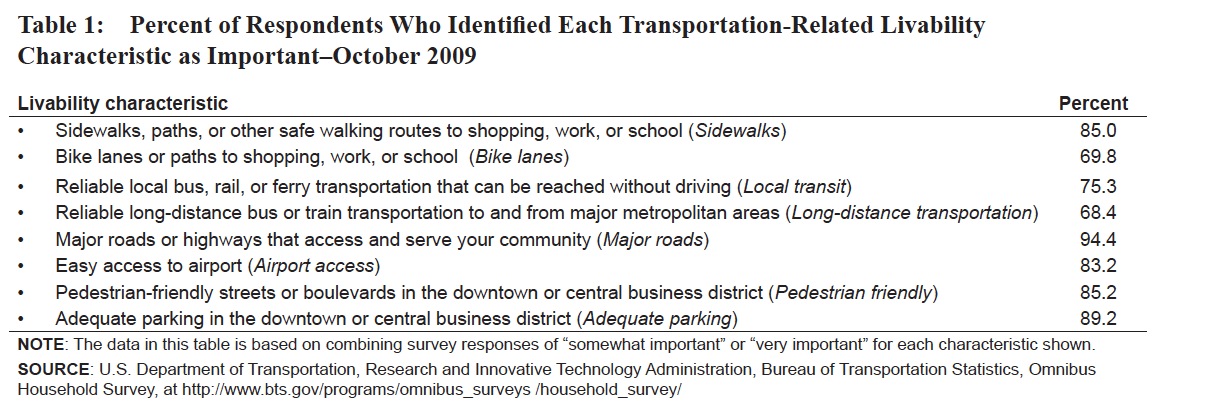
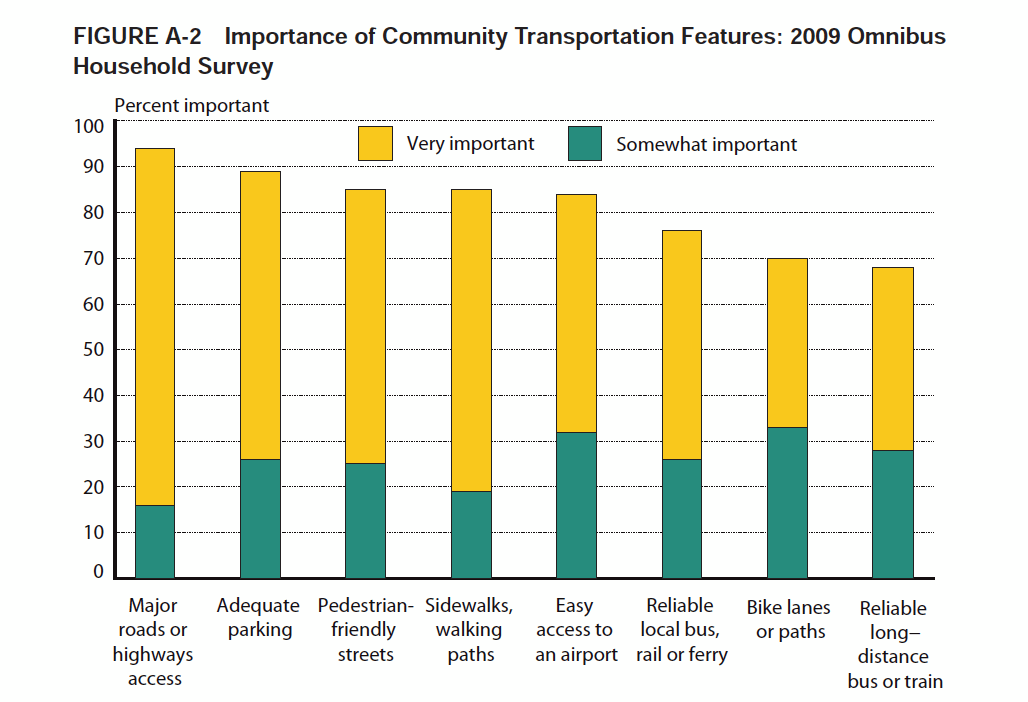
Responses to the 2009 OHS suggest that a majority of the public considered it important to have a wide range of transportation alternatives. The majority also strongly supported the provision of facilities that permit continued reliance on the personal automobile in the community in which they live.
Transportation Statistics Annual Report (TSAR) 2010
Monday, June 6th, 2011BUREAU OF TRANSPORTATION STATISTICS (BTS)
RESEARCH AND INNOVATIVE TECHNOLOGY ADMINISTRATION (RITA), U.S. DEPARTMENT OF TRANSPORTATION
The Transportation Statistics Annual Report (TSAR) presents data and information compiled by the Bureau of Transportation Statistics (BTS), a component of the U.S. Department of Transportation’s (USDOT’s) Research and Innovative Technology Administration (RITA), to fulfill its legislative mandate. The RITA/BTS mandate covers all modes of transportation and calls for the collection and analysis of transportation data on topics relevant to USDOT’s strategic goals.
The Annual Highlights section focuses on recent USDOT efforts to collect, compile, analyze, and publish transportation data and analysis. Such efforts include the following:
* the Survey of State Funding for Public Transportation,
* Livable Communities and Environmental Sustainability highlights from the Omnibus Household Survey, and
* Commodity Flow Survey (CFS) data and analysis on Hazardous Materials (Hazmat) shipments.
Surface Trade with Canada and Mexico
Tuesday, May 31st, 2011RESEARCH AND INNOVATIVE TECHNOLOGY ADMINISTRATION
BUREAU OF TRANSPORTATION STATISTICS
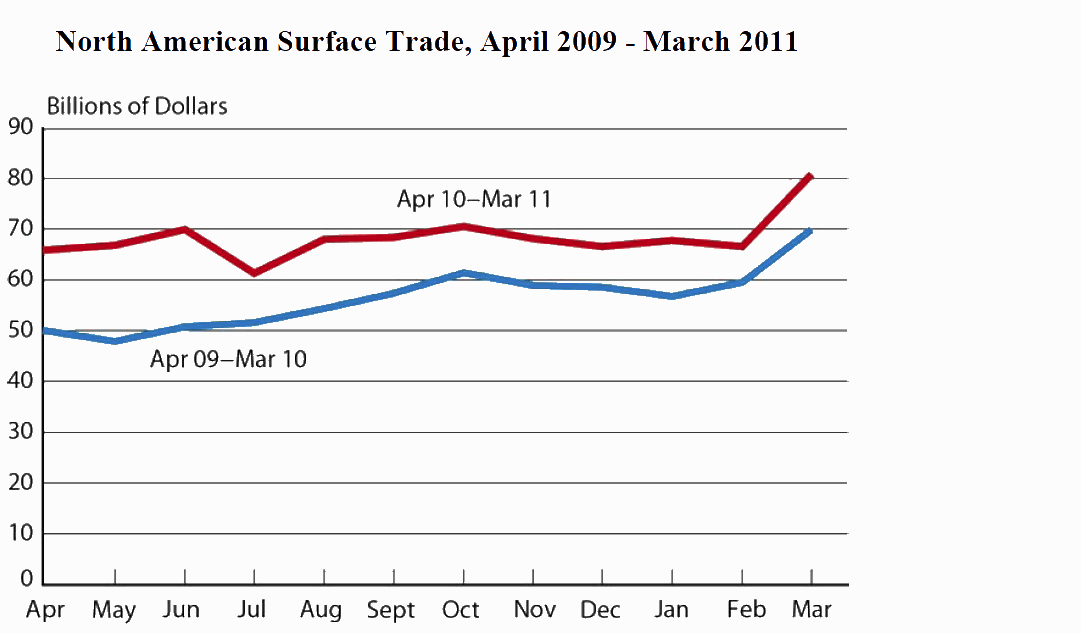
Surface transportation includes freight movements by truck, rail, pipeline, mail, Foreign Trade Zones and other. In March, 85.8 percent of U.S. trade by value with Canada and Mexico moved on land, 9.8 percent moved by vessel, and 4.4 percent moved by air.
…The value of U.S. surface transportation trade with Canada and Mexico in March was up 18.5 percent compared to March 2006, and up 60.9 percent compared to March 2001, a period of 10 years. Imports in March were up 52.2 percent compared to March 2001, while exports were up 72.3 percent (Table 3).
Follow InfrastructureUSA
CATEGORIES
- Accountability (219)
- Aging Infrastructure (757)
- Aviation (130)
- Biking (323)
- Bipartisan (271)
- Bridges (493)
- Broadband (57)
- Buses (160)
- Carbon Tax (22)
- Clean Air (182)
- Climate Change (200)
- Competitiveness (230)
- Congestion (327)
- Dams (77)
- Democrat (123)
- Drinking Water (192)
- Economic Stimulus (276)
- Employment (207)
- Energy (585)
- Environment (615)
- Equity (239)
- Funding (888)
- Global (205)
- Great American Infrastructure (33)
- Green (294)
- Guests on The Infra Blog (285)
- Hazardous Waste (27)
- High Speed Rail (224)
- Highway (785)
- Inland Waterways (204)
- Jobs (251)
- Land Use (98)
- LEED (28)
- Levees (42)
- Local (1,910)
- National (1,526)
- Policy (1,121)
- Pollution (215)
- Private Investment (213)
- Public Opinion (189)
- Public Parks & Recreation (197)
- Public Transportation (1,028)
- Racism (6)
- Rail (503)
- Recession (65)
- Recovery (218)
- Republican (109)
- Roads (1,120)
- Schools (81)
- Seaports (69)
- Smart Grid (98)
- Smart Growth (442)
- Solid Waste (26)
- Sustainability (765)
- Tax (112)
- Technology (397)
- Telecommunications (46)
- Transit (1,333)
- Urban Planning (981)
- Wastewater (182)
- Water Treatment (167)
Video, stills and tales. Share images of the Infra in your community that demands attention. Post your ideas about national Infra issues. Go ahead. Show Us Your Infra! Upload and instantly share your message.
Is the administration moving fast enough on Infra issues? Are Americans prepared to pay more taxes for repairs? Should job creation be the guiding determination? Vote now!
What do the experts think? This is where the nation's public policy organizations, trade associations and think tanks weigh in with analysis on Infra issues. Tell them what you think. Ask questions. Share a different view.
The Infra Blog offers cutting edge perspective on a broad spectrum of Infra topics. Frequent updates and provocative posts highlight hot button topics -- essential ingredients of a national Infra dialogue.
Dear Friends,
It is encouraging to finally see clear signs of federal action to support a comprehensive US infrastructure investment plan.
Now more than ever, our advocacy is needed to keep stakeholders informed and connected, and to hold politicians to their promises to finally fix our nation’s ailing infrastructure.
We have already engaged nearly 280,000 users, and hoping to add many more as interest continues to grow.
We require your support in order to rise to this occasion, to make the most of this opportunity. Please consider making a tax-deductible donation to InfrastructureUSA.org.
Steve Anderson
Managing Director
SteveAnderson@InfrastructureUSA.org
917-940-7125