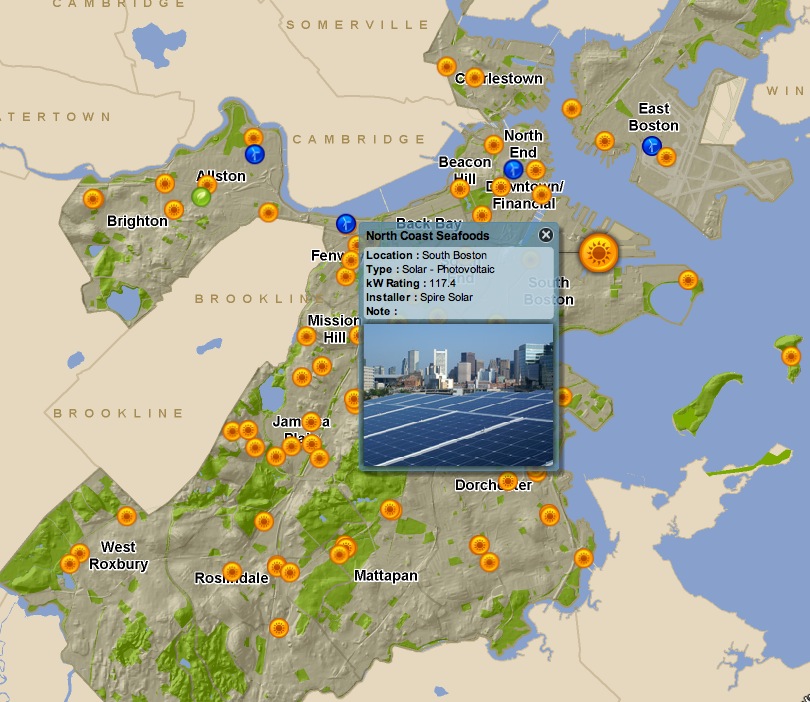
Boston, MA is full of sustainable energy projects, and CityofBoston.gov created an interactive map to show where they’re taking place.
View this complete post...


John Hennessy III,
P.E.





Boston, MA is full of sustainable energy projects, and CityofBoston.gov created an interactive map to show where they’re taking place.
View this complete post...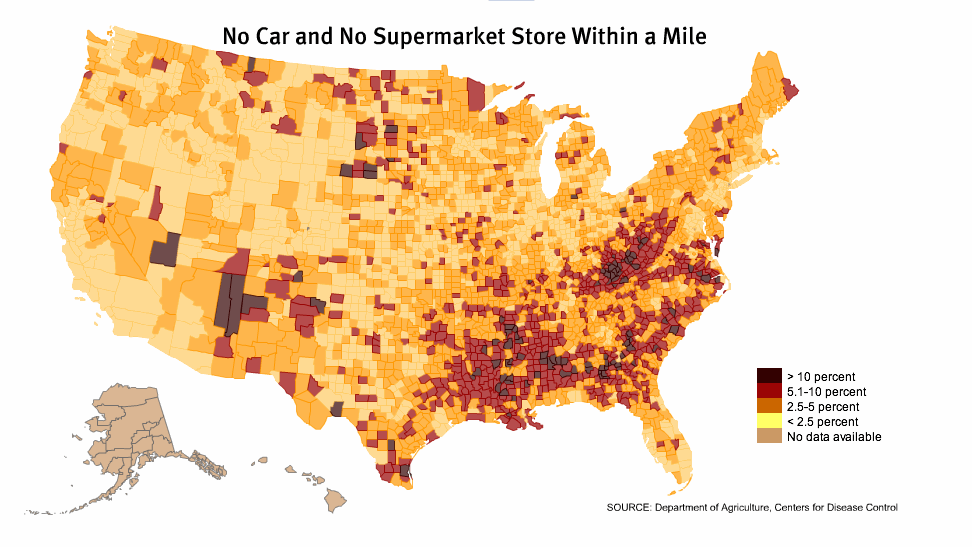
According to Slate, “Much of the public health debate over rising obesity rates has turned to these “food deserts,” where convenience store fare is more accessible—and more expensive—than healthier options farther away…” A comment sums up the issue: “As our population ages, more and more will have to move out of rural areas into urban centers where services and basic necessities can be reached via public transportation. I wish our government and local planners had the wisdom to anticipate such problems”
View this complete post...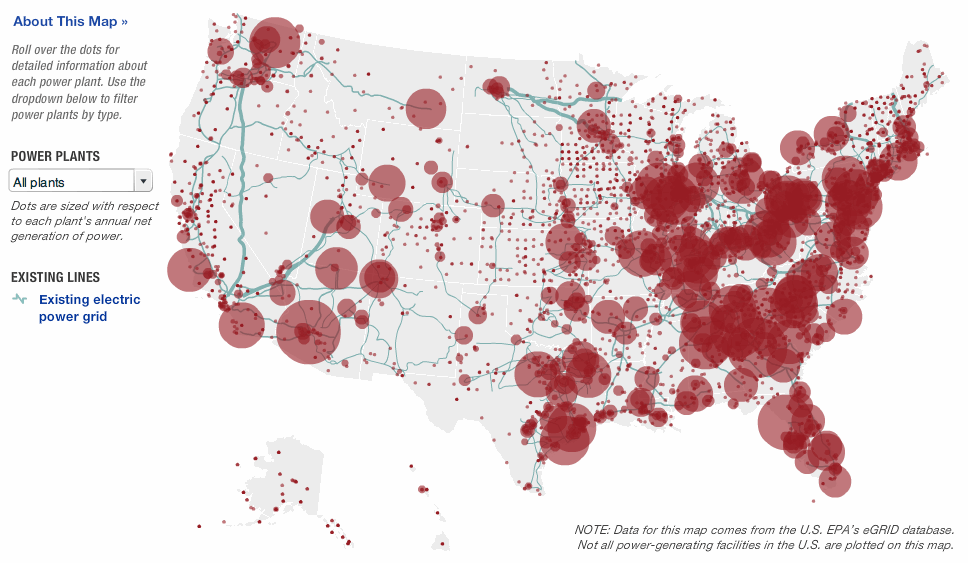
“The U.S. electric grid is a complex network of independently owned and operated power plants and transmission lines. Aging infrastructure, combined with a rise in domestic electricity consumption, has forced experts to critically examine the status and health of the nation’s electrical systems.”
-National Public Radio
An interactive map from National Public Radio visualizes the U.S. electric grid through transmission lines, sources of power, power plants. The map also displays the location and capacity of planned, potential and existing solar and wind power.
View this complete post...
An interactive map from the Wall Street Journal displays the severity of the flooding currently happening in the US Midwest, where “Monday evening, the Ohio River gauge at Cairo read 61.44 feet, nearly two feet higher than the record of 59.51 feet set in 1937.”
View this complete post...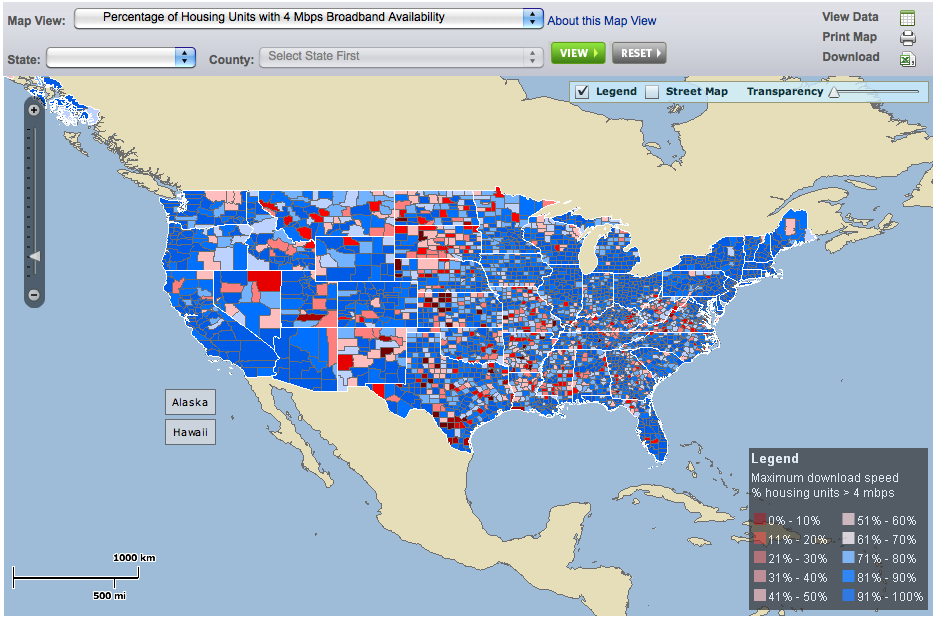
An interactive map of broadband stats including use and availability across the country is offered by the National Broadband Plan of the Federal Communications Commission (FCC).
View this complete post...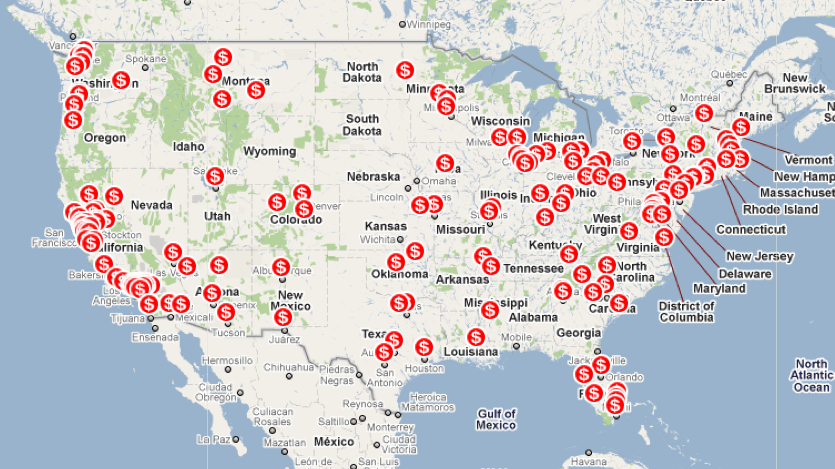
Public transportation ridership is at record highs, according to Transportation for America, but transportation agencies across the country are making service cuts, layoffs, and fare increases. T4A’s interactive map shows the cuts in various transit systems across the country. Along with current budget deficits, it displays other useful data like total number of riders, fare increases, and service changes. T4A also allows users to join the action by sharing their transit experiences for an upcoming congressional lobbying campaign.
View this complete post...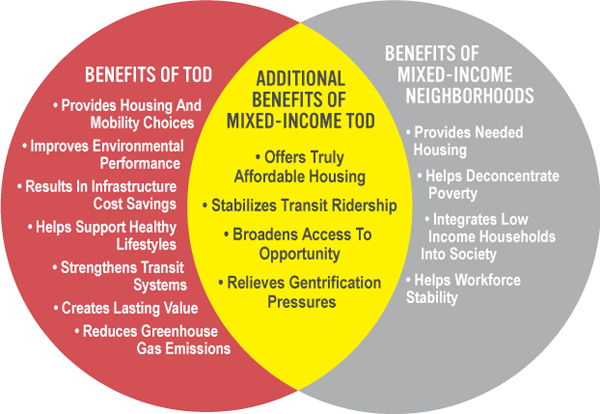
The goal of the newly-released Mixed Income Transit Oriented Development Action Guide is to “help practitioners identify the most appropriate and effective planning tools for achieving MITOD in their transit station area, and ultimately to facilitate the development of mixed-income communities across the U.S.” It was developed by the Center for Transit Oriented Development (CTOD) along with the Federal Transit Administration and the U.S. Department of Housing and Urban Development.
View this complete post...With the upcoming holiday season, travelers can count on increased traffic challenges. It may be an appropriate time to become more focused on transportation issues. Transportation for America has prepared an information-packed interactive map for each state, so see how your state measures up against the rest of the nation. And, please share your holiday travel stories with us at InfrastructureUSA.org.
View this complete post...UNION OF CONCERNED SCIENTISTS
“Recognizing the urgency of global warming, policy makers are beginning to pursue solutions to help us avoid the worst effects of climate change, while transitioning the nation to a clean energy economy. However, the debate over comprehensive climate and energy policy often focuses on the costs of climate action, rather than on the serious economic and environmental consequences if we fail to act. One study shows that if global warming emissions continue to grow unabated—a high-emissions scenario—the annual economic impact of more severe hurricanes, residential real-estate losses to sea-level rise, and growing water and energy costs could reach 1.4 percent of GDP by 2025, and 1.9 percent by 2100 (Ackerman and Stanton 2008).”
Follow InfrastructureUSA
Video, stills and tales. Share images of the Infra in your community that demands attention. Post your ideas about national Infra issues. Go ahead. Show Us Your Infra! Upload and instantly share your message.
Is the administration moving fast enough on Infra issues? Are Americans prepared to pay more taxes for repairs? Should job creation be the guiding determination? Vote now!
What do the experts think? This is where the nation's public policy organizations, trade associations and think tanks weigh in with analysis on Infra issues. Tell them what you think. Ask questions. Share a different view.
The Infra Blog offers cutting edge perspective on a broad spectrum of Infra topics. Frequent updates and provocative posts highlight hot button topics -- essential ingredients of a national Infra dialogue.
It is encouraging to finally see clear signs of federal action to support a comprehensive US infrastructure investment plan.
Now more than ever, our advocacy is needed to keep stakeholders informed and connected, and to hold politicians to their promises to finally fix our nation’s ailing infrastructure.
We have already engaged nearly 280,000 users, and hoping to add many more as interest continues to grow.
We require your support in order to rise to this occasion, to make the most of this opportunity. Please consider making a tax-deductible donation to InfrastructureUSA.org.
Steve Anderson
Managing Director
SteveAnderson@InfrastructureUSA.org
917-940-7125