TEXAS TRANSPORTATION INSTITUTE
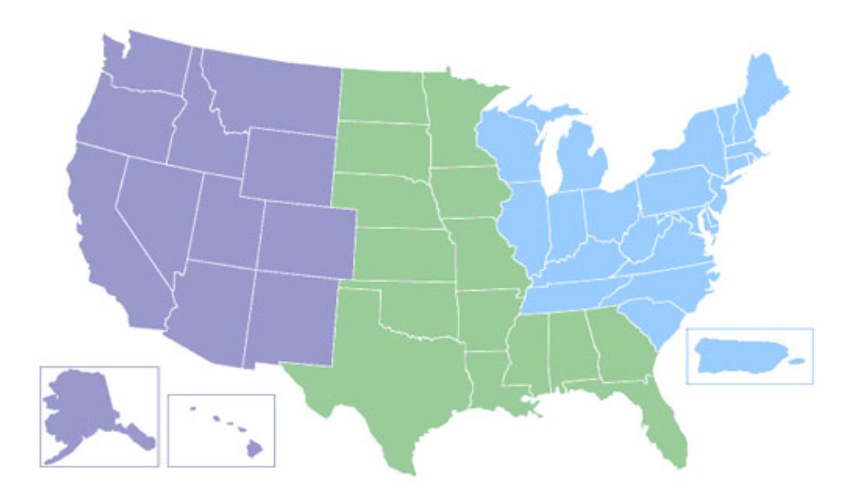
Each regional map has dots linking to a file containing the Urban Mobility and Congestion Statistics—congestion index, travel delay, fuel consumption, congestion cost—for every city included in the study. The files are in PDF format. You can get the numbers—all the numbers—for each of the 101 cities. You can also view the national congestion tables which provide comparison measurements for all 101 cities included in the study.


 RSS Feed