THE SOLAR FOUNDATION
About This Map
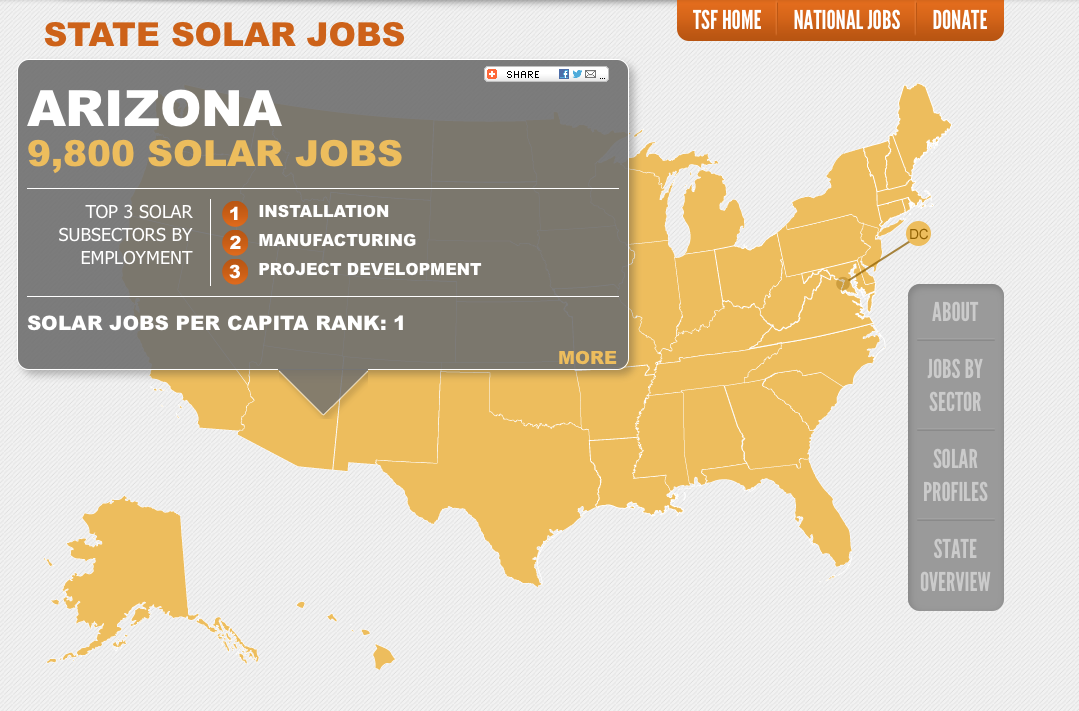
Employment figures in the State Solar Jobs Map were generated using thousands of data points from a combination of high-quality sources, including The Solar Foundation’s National Solar Jobs Census 2012, the Solar Energy Industries Association’s National Solar Database, and other sources. These numbers are believed to be the most credible and up-to-date state-level jobs numbers in existence. It is also the first time that all 50 states are highlighted. While many states may benefit from conducting their own jobs studies, the cost of doing so is often prohibitive. This comprehensive state approach also allows for better analysis. For a discussion of the research findings and takeways visit The Solar Foundation’s blog.
State jobs numbers were produced using a carefully developed dual methodology – one for installation and construction jobs and another for non-installation jobs (covering industry subsectors such as manufacturing, sales and distribution, project development, and “other” occupations that support the solar industry). In brief, method one uses labor intensity multipliers developed internally and cross checked with leading studies on the subject while method two is based not only on a direct count of solar workers, but also the average number of jobs per solar establishment and total number of establishments in each state. The state totals are the rounded average of our high and low estimates.
The state solar jobs numbers and subsector rankings provided in the map are wholly original figures published by The Solar Foundation. “Solar Jobs Per Capita” ranks and “Employed Persons Per Solar Worker” were derived using TSF’s solar jobs estimates and labor force figures from the Bureau of Labor Statistics. Other non-jobs related facts and figures included in the map were compiled from a variety of sources. “Maximum Solar Resource” estimates and ranks were produced using data from the National Renewable Energy Laboratory. The Solar Energy Industries Association provided the data used to estimate the figures for the “Number of Homes Powered by Solar” field. “Electricity Price Rank” is based on data from the U.S. Energy Information Administration. “Net Metering Policy Grade” and “Interconnection Policy Grade” were both obtained from Freeing the Grid 2013, a joint project of The Vote Solar Initiative, the Interstate Renewable Energy Council, the North Carolina Solar Center, and the Network for New Energy Choices. Information on the “Legal Status of Third-Party Ownership”, “Renewable Portfolio Standard Target”, and “RPS Solar Carve-out Target” was all sourced from the Database of State Incentives for Renewables and Efficiency, produced and maintained by the North Carolina Solar Center at N.C. State University.
View Interactive Map here: State Solar Jobs Map
About The Solar Foundation
www.thesolarfoundation.org
“The Solar Foundation is an independent national 501(c)(3) nonprofit working to demonstrate the global benefits of solar energy through research and education. Founded in 1977 and based in Washington, DC, we are increasing the widespread adoption of solar energy and transforming the marketplace through our coordinated public education & outreach efforts, high-level data collection, and innovative research. “
Tags: clean jobs, State Solar Jobs Map, The Solar Foundation


 RSS Feed