NYPIRG STRAPHANGERS CAMPAIGN
Findings
What do subway riders want?
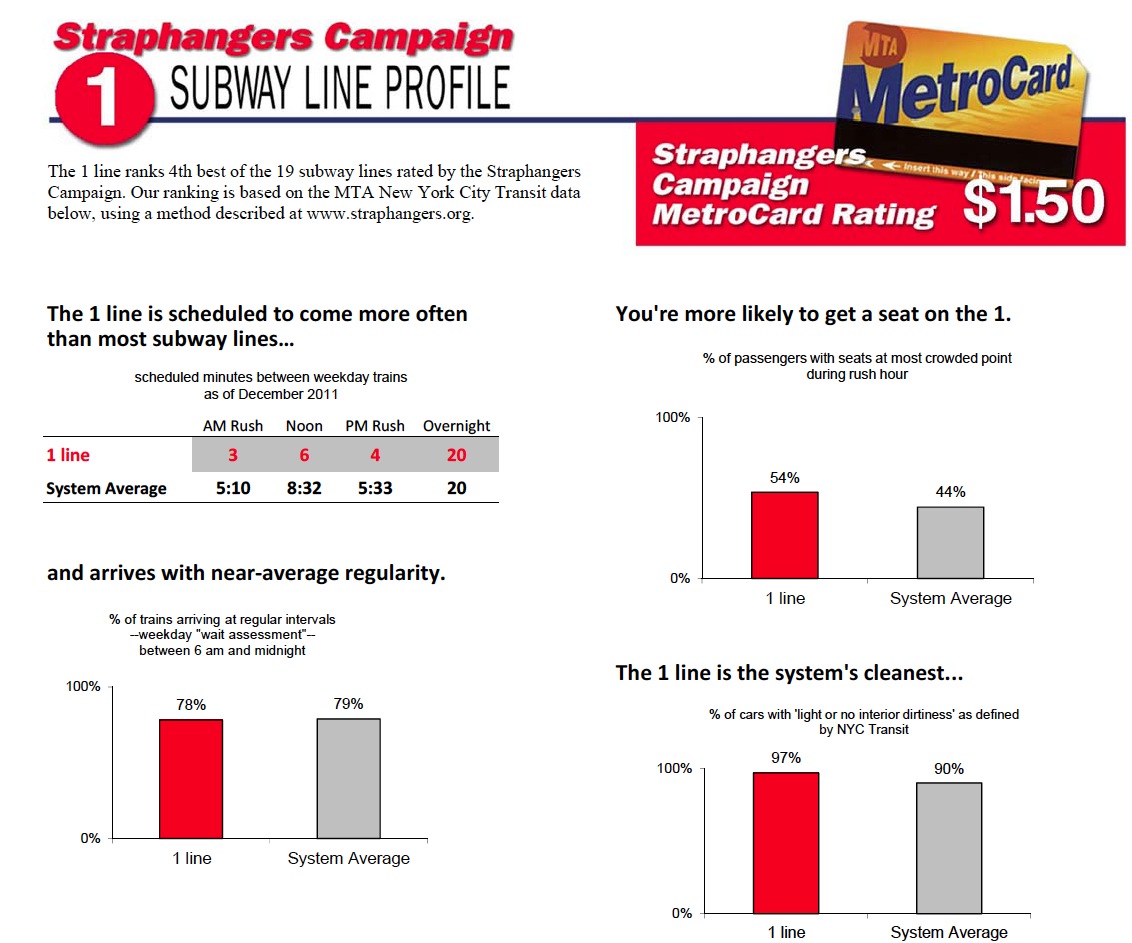
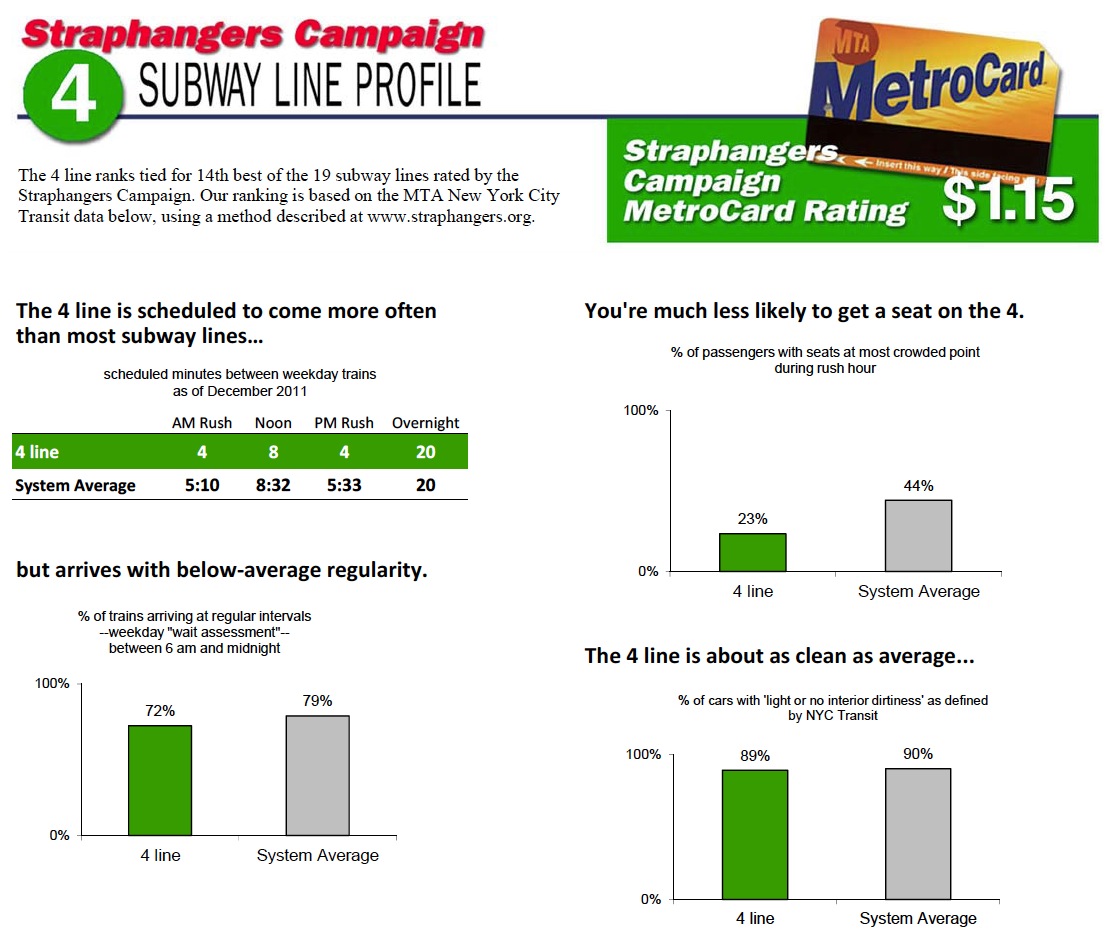
They want short waits, trains that arrive regularly, a chance for a seat, a clean car and understandable announcements that tell them what they need to know. That’s what MTA New York City Transit’s own polling of rider satisfaction measures.
This “State of the Subways” Report Card tells riders how their lines do on these key aspects of service. We look at six measures of subway performance for the city’s 20 major subway lines, using recent data compiled by MTA New York City Transit. Some of the information has not been released publicly before on a line-by-line basis. Most of the measures are for all or the last half of 2011.
Our Report Card has three parts:
First, is a comparison of service on 20 lines, as detailed in the attached tables.
Second, we give an overall “MetroCard Rating” to 19 of the 20 major lines.
Third, the report contains one-page profiles on each of the 20 lines. These are intended to provide riders, officials and communities with an easy-to-use summary of how their line performs compared to others.
This is the fifteenth Subway Report Card by the Straphangers Campaign since 1997.
Download full report (PDF): State of the Subways Report Card 2012
About NYPIRG Straphangers Campaign
www.straphangers.com
“The campaign was founded in 1979 by the New York Public Interest Research Group at a critical time for New York City transit: By the late 1970s, the city’s subways had become unreliable and decrepit. Graffiti covered every car and station. Transit fires and derailments hit record levels. Crime steadily worsened. Ridership plummeted to the lowest level in 80 years. Businesses cited poor transit as a leading reason for moving out of New York. The system had become a symbol of the decline of the city itself.”
Tags: Manhattan, New York, New York City, New York Public Interest Research Group, NY, NYPIRG, Straphangers


 RSS Feed