


NATIONAL ASSOCIATION OF CITY TRANSPORTATION OFFICIALS (NACTO)
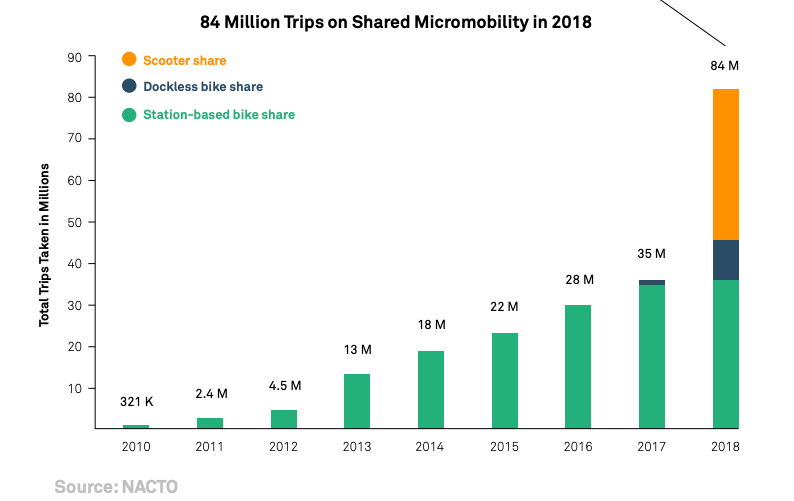
In 2018, people took 84 million trips on Shared Micromobility in the United States, more than double the number of trips taken in 2017.
Shared Micromoblity encompasses all shared-use fleets of small, fully or partially human-powered vehicles such as bikes, e-bikes, and e-scooters.
Since 2010, people have taken 207 million trips on shared bikes and e-scooters.
Key findings from NACTO’s 2018 shared micromobility ridership report:
- More than twice as many trips—84 million—were taken on shared micromobility in the U.S. as compared to the year before. 36.5 million trips were taken on station-based bike share, an increase of 9% from 2017. 9 million trips were taken on dockless shared bikes. 38.5 million trips were taken on shared scooters, reflecting the wide proliferation of vehicles in many cities.
- Dockless pedal (non electric) bikes have largely disappeared from most U.S. cities; in part replaced by shared scooters. Approximately 44,000 dockless pedal bikes were on the ground in the U.S. at the end of 2017, most of which are no longer in use. Most dockless bike share companies retooled their fleets to focus on e-scooters, and new e-scooter-focused companies emerged. There are now tens of thousands of e-scooters on the ground in U.S. cities.
- E-bikes, while limited in rollout, have been heavily used in the cities with substantial e-bike fleets. The shared micromobility vehicles with the most use (as measured by rides/vehicle/day) are e-bikes, used twice as frequently as pedal bikes. Many bike share companies have plans to rapidly expand their e-bike fleets, with Minneapolis planning to transition entirely to an e-bike-based fleet from pedal bikes, and New York City planning for a fleet that is a third electric.
- The largest bike share systems are more heavily utilized, on a per-bike basis, than smaller systems; scooter share systems have the opposite correlation. The largest bike share systems see their bikes utilized, on average, twice per day or more (including in winter months), and most of the smallest systems see their bikes utilized less than once per day. For scooters, initial data shows the inverse: the largest fleets of shared scooters were used less than once per day, and the smallest fleets of shared scooters were used more than four times per day. Bike share benefits from a network effect of a dense network of conveniently placed bikes over a large area; scooter share ridership does not yet seem to benefit from a network effect.
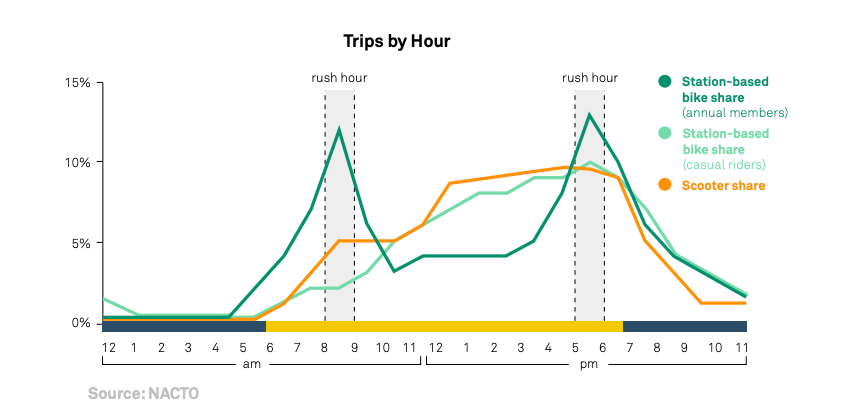
- Station-based bike share is most heavily utilized during traditional rush hours. Scooter share rides are more evenly dispersed throughout the day, with the highest ridership on Fridays and weekends. These findings suggest that people are using bike share and scooter share for different trip types, a finding reinforced by surveys in cities of bike share and scooter share users.
Goodbye dockless pedal bikes; hello e-scooters.
In 2018, e-scooters overtook bikes as the preferred vehicle for dockless vendors. As of the end of 2018, over 85,000 e-scooters were available for public use in about 100 U.S. cities. In contrast, dockless bikes, which once numbered in the tens of thousands, have largely disappeared from city streets, with the notable exception of dockless bikes still in use in Seattle.
Over the course of 2018, most dockless bike share companies (including Lime and Spin) retooled their fleets to focus on e-scooters, and new e-scooter-only companies (including Bird) emerged. Early e-scooter adopter cities include Santa Monica and Austin, and e-scooter companies expanded to many more cities from there, with about 26 formal e-scooter share pilots across the U.S. launching between July and September.
Venture capital-backed ride-hail companies began investing large sums in shared micromobility companies, with Uber acquiring Jump Bikes and Lyft acquiring Motivate, the operator of the five largest docked bike share systems in the U.S.
More than twice as many trips—84 million— were taken on shared micromobility in the U.S. as compared to the year before.
36.5 million trips were taken on station-based bike share, an increase of 9% from 2017. While 9 million trips were taken on dockless bike share, this number is expected to decrease in 2019 due to the disappearance of most dockless shared bikes across the U.S. 38.5 million trips were taken on scooters across the U.S., reflecting the wide proliferation of vehicles in many cities.
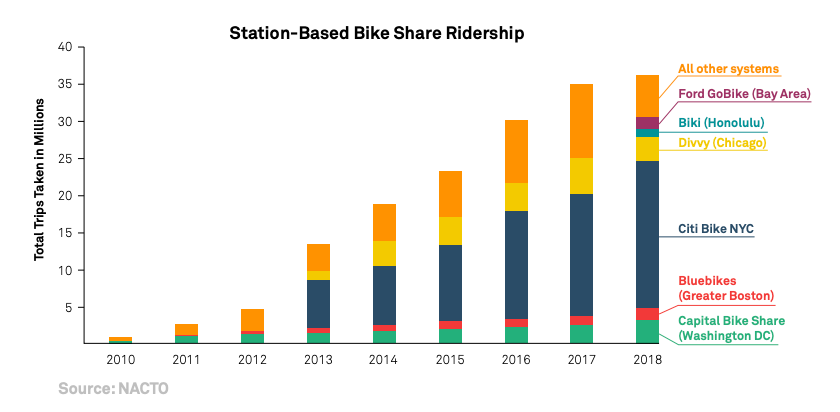
In station-based bike share systems, a number of system expansions resulted in increased ridership. Three of the top five bike share cities (Washington DC, Metro Boston, and the Bay Area, CA) increased the number of stations in their system. In total, there are now 57,000 station-based bike share bikes in the U.S., up 9% from 2017.
In the Bay Area, Ford GoBike expanded its fleet 10-fold, and increased ridership by 260%. Similarly, in Honolulu, Biki increased its fleet by 30%, and trips increased by 200%. In Metro Boston, Bluebikes expanded its fleet by 40%, and ridership increased by 30%. Boston also increased its coverage area: as of the end of 2018, 85% of Boston residents live within a 5-7 minute walk from a Bluebikes station, up from 67% in 2017.
The six cities with the highest ridership account for 84% of all station-based bike share trips in the U.S., similar to prior years. E-scooter ridership similarly is concentrated in a small number of cities: 40% of all e-scooter trips took place in the Los Angeles, San Diego, and Austin regions.
Why people are riding depends on what they’re riding.
NACTO’s analysis of ridership data shows a marked difference between the riding patterns of annual or monthly pass station-based bike share riders and day-pass/ single-trip or casual bike share riders. In general, annual/monthly pass holders are more likely to ride during traditional rush hours, suggesting that they are using the system for commute trips. In contrast, day/ single trip riders are more likely to ride in the middle of the day and on weekends, and for longer periods of time, suggesting social, shopping and other recreational use.
Data from Washington, DC and Portland, OR, suggests that e-scooter share use more closely mirrors that of social, shopping and other recreational bike share use. Average peak usage for e-scooters begins around 11AM – 12PM and continues throughout the afternoon into early evening. E-scooters are used throughout the week but use is highest on weekends. In contrast, aggregated data from station-based systems shows ridership peaking at rush hours and during the week.
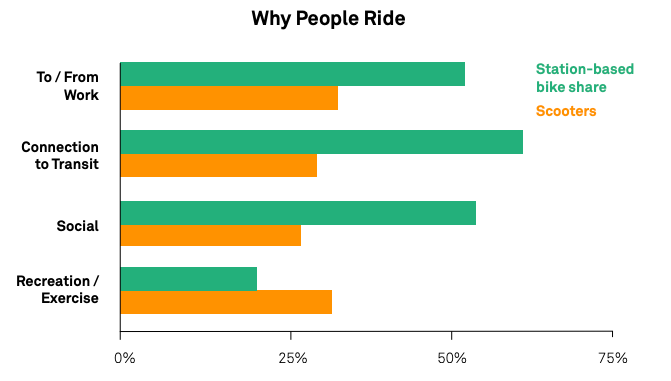
Survey data from a number of cities also shows a difference in why people choose to ride. People using station-based bike share are more likely than people using e-scooter share to report that they ride to get to/from work and to say that they use bike share to connect to transit.
A rapidly changing market raises questions about system dependability.
In 2018, the volatile nature of the dockless landscape left some cities in a vulnerable position. For example, Camden, NJ, aiming to expand transportation options for low-income residents, welcomed Ofo, a dockless bike share company, onto its streets in early 2018. However, two months into their six-month pilot, Ofo abruptly left the city, leaving Camden without a bike share program and leaving behind a fleet of abandoned bikes, which had to be located, impounded, and disposed of by the city.
State-level legislation might hinder cities from managing their own streets.
In many states, e-scooters are not defined in motor vehicle codes, creating a legal gray area for their operation. In response, e-scooter companies are pushing legislation in many states to legalize e-scooter use. However, some state bills go beyond defining and legalizing e-scooters. As currently drafted, these bills would preempt city authority to regulate shared micromobility services. With this, cities could lose the ability to manage the activity on their own streets, hindering efforts to ensure that systems are safe and provide the most mobility benefits to the communities in which they operate.
As of the beginning of 2019, there were over 44 e-scooter bills introduced in 26 states.
Download full version (PDF): Shared Micromobility in the U.S.: 2018
About the National Association of City Transportation Officials (NACTO)
nacto.org
NACTO is an association of 68 major North American cities and 11 transit agencies formed to exchange transportation ideas, insights, and practices and cooperatively approach national transportation issues. NACTO’s mission is to build cities as places for people, with safe, sustainable, accessible and equitable transportation choices that support a strong economy and vibrant quality of life.
Tags: Bike Share, dockless pedal bikes, e-bikes, e-scooters, NACTO, National Association of City Transportation Officials, scooter share, shared micromobility, station-based bike share
 RSS Feed