FEDERAL HIGHWAY ADMINISTRATION
Executive Summary
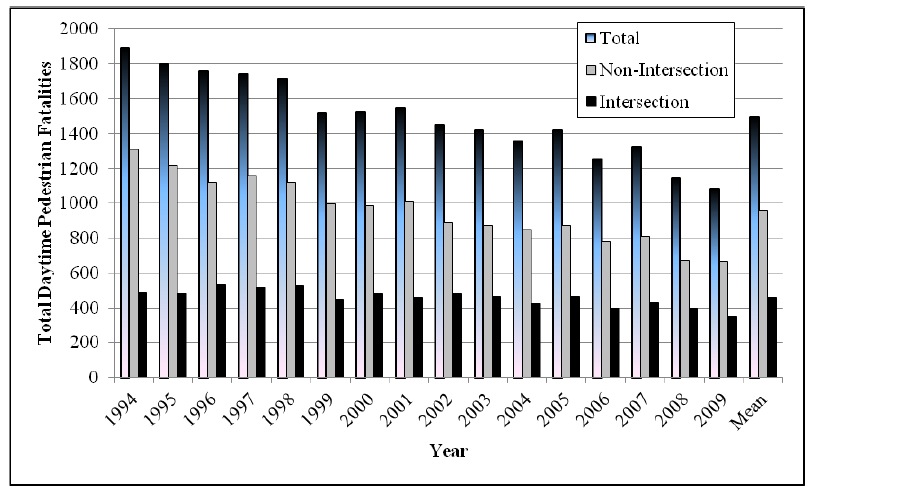
 Pedestrian–vehicle crashes are both common and deadly. In 2010, 13 percent of all fatal crashes
involved pedestrians. Of these, 68.1 percent occurred outside intersections. As a result of the
large proportion of pedestrian fatalities that occur at non-intersection locations, it is important to
investigate the causal factors of these collisions. Despite the large proportion of crashes, little
research has investigated the reasons pedestrians cross roadways at unmarked locations.
As a result, the present study sought to better understand the environmental influences on both
where and when pedestrians elect to cross the road. The circumstances surrounding when and
where more than 70,000 crossings took place were recorded and analyzed. A model to predict
crossing behaviors was created. These data have the potential to guide roadway design.
Furthermore, this approach may aid in the selection and location of pedestrian crossing
interventions (e.g., new pedestrian activation crossing beacons), ultimately increasing pedestrian
safety in shared use environments.
Pedestrian roadway crossings were coded at 20 different locations in the Washington, DC,
metropolitan area. Each location was one block in length and was flanked by two marked
crosswalks at intersections. Crossings were recorded within one marked, light-controlled
crosswalk and the roadway between it and the next marked crossing (but not within the far
crossing). Pedestrian crossings were coded for several different factors:
A. Location. Within the marked crosswalk, or not.
B. Traffic status. Walk or don’t walk sign illuminated.
C. Yielding. Pedestrians yielding to vehicles or vehicles yielding to pedestrians in the
roadway.
D. Evasive Actions. Any evasive movement made by a vehicle or pedestrian to avoid
collision (e.g., running or abrupt braking).
Stable components of each location were also recorded:
1. Distance between the marked crosswalks.
2. Average annual daily traffic volume (AADT).
3. Street directionality (one- or two-way).
4. Physical barriers in or along the roadway that might prevent pedestrians from easily
crossing between the roadway and sidewalk.
5. Presence and location of bus stops.
6. Number of potential pedestrian trip originators/destinations.
7. Availability of street parking.
8. Presence of a center turn lane.
9. Presence of a right turn only turning lane
10. Length of the walk light phase.
11. Length of the don’t walk light phase.
12. Width of the roadway/pedestrian crossing.
13. Presence and type of median (e.g., raised concrete or painted asphalt).
14. Presence of a T-intersection between the two marked crosswalks.
15. Traffic control device of the second crosswalk (i.e., traffic signal, stop sign, or none).
16. Pace at which pedestrians are required to travel to complete a crossing entirely during the walk light phase.

Download full version (PDF): Human Factors Assessment of Pedestrian Roadway Crossing Behavior
About the Federal Highway Administration
www.fhwa.dot.gov
“The Federal Highway Administration (FHWA) is an agency within the U.S. Department of Transportation that supports State and local governments in the design, construction, and maintenance of the Nation’s highway system (Federal Aid Highway Program) and various federally and tribal owned lands (Federal Lands Highway Program). Through financial and technical assistance to State and local governments, the Federal Highway Administration is responsible for ensuring that America’s roads and highways continue to be among the safest and most technologically sound in the world.”
Tags: Federal Highway Administration, FHA, Pedestrian, U.S. Department of Transportation


 RSS Feed