INSTITUTE FOR TRANSPORTATION AND DEVELOPMENT POLICY
An Analysis of 21 North American Transit Corridors
Executive Summary
 In the wake of the 2008 economic downturn, Cleveland, Ohio, along with other former industrial US cites, faced severe financial difficulties. While a tough regional economy and shrinking population forced many of the surrounding cities to cut public services and reduce jobs in the public and private sectors, Cleveland managed to transform a modest $50 million investment in bus rapid transit into $5.8 billion in new transit-oriented development. By putting bus rapid transit (BRT) along a strategic corridor and concentrating government redevelopment efforts there, Cleveland managed to leverage $114.54 dollars of new transit-oriented investment for every dollar it invested into the BRT system, adding jobs and revitalizing the city center.
A growing number of American cities are promoting transit-oriented development1 (TOD) in order to combat congestion and other problems associated with sprawling, car-dominated suburban growth. Many are planning rail-based mass transit investments like light rail transit (LRT) and streetcars, hoping they will stimulate transit-oriented development, but are finding the costs to be crippling.
Increasingly, cities in the US, finding themselves short of funds, are wondering whether BRT, a lower cost mass transit solution initially developed in Latin America and a relatively new form of mass transit in the US, could also be used here to leverage transit-oriented development investments.
Cleveland is not the only success story. Pittsburgh, Las Vegas, Ottawa, and Eugene all received returns on their investments into BRT. This report evaluated 21 LRT, BRT, and streetcar corridors in 13 cities across the US and Canada and features case studies on the successes in Cleveland, Ohio and Pittsburgh, Pennsylvania. To make it possible to compare systems of similar quality, it uses The BRT Standard, a new tool developed by the world’s leading BRT experts, which defines and evaluates the quality of BRT and has encouraged a more rigorous distinction between bus improvement and this new form of transit. As many of the most important attributes of BRT are also important attributes of LRT, we were able to use The BRT Standard to score LRT corridors as well.
In the past decade, the emergence of seven new corridors in the US that have ranked as true BRT has been a major step in establishing a new paradigm for transit.
While the belief that LRT is more likely to have significant TOD impacts than BRT is widespread, the matter had not, until now, been systematically studied.
The report found the following:
- Per dollar of transit investment, and under similar conditions, Bus Rapid Transit leverages more transit-oriented development investment than Light Rail Transit or streetcars.
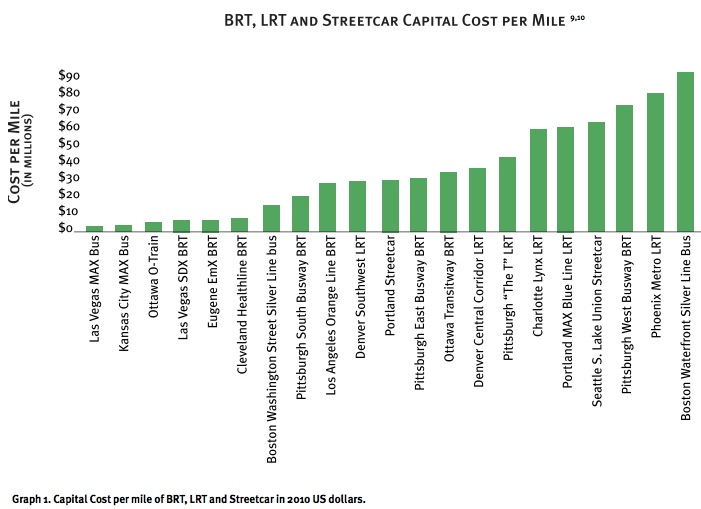
Cleveland’s HealthLine BRT and Portland’s MAX Blue Line LRT leveraged the most overall TOD investment of all the corridors we studied—$5.8 billion and $6.6 billion, respectively. Yet, because the HealthLine BRT cost significantly less to build than the MAX Blue Line LRT, Cleveland’s HealthLine BRT leveraged approximately 31 times more TOD investment per dollar spent on transit than Portland’s MAX Blue Line LRT. - Both BRT and LRT can leverage many times more TOD investment than they cost.
Of the 21 corridors we studied, 14 leveraged greater than $1 of TOD investment per $1 of transit spent. Five of them were BRT, four of them were LRT, two were streetcars, and three were improved bus (non-BRT) corridors. - Government support for TOD is the strongest predictor of success.
A government that sees potential in a site for development can provide a range of support from regulatory changes to financing to marketing of the area. There is nearly a direct correlation between the level of TOD investment and the strength of government support. If a government does nothing to support TOD along the transit corridor, there will be no TOD impact. - The strength of the land market around the transit corridor is the secondary indicator of success.
Where governments provide moderate support for TOD, the existing market strength of the land determines the level of TOD investment. Today, downtowns tend to be strong land markets, so having the transit investment pass through downtown leads to better TOD impacts. - The quality of the transit investment –how well it meets the best-practices detailed in the BRT Standard—is the tertiary indicator of success.
Holding constant for level of government support and potential of the land to develop, the quality of the transit investment is generally the final indicator of the level of TOD investment.
Download full report (PDF): More Development for Your Transit Dollar
About the Institute for Transportation and Development Policy
www.itdp.org
“The Institute for Transportation and Development Policy works with cities worldwide to bring about sustainable transport solutions that cut greenhouse gas emissions, reduce poverty, and improve the quality of urban life.”
Tags: BRT, Bus Rapid Transit, Cleveland, Institute for Transportation and Development Policy, ITDP, OH, Ohio, TOD, Transit-Oriented Development


 RSS Feed