FLORIDA STATE UNIVERSITY DEPARTMENT OF URBAN & REGIONAL PLANNING
Gregory L. Thompson and Jeffrey R. Brown Florida State University
Introduction
A new era of transit development began in 1981 when San Diego, a city whose transit system contained only buses, opened its first regional light rail transit (LRT) line. Since then, 11 other U.S., previously bus-only metropolitan areas opened their own LRT lines. Several of these new LRT lines have become the backbones of metropolitan transit systems, carrying a large share of the metropolitan area’s total transit ridership. In this paper, we examine transit performance in five such metropolitan areas, with the objective of identifying whether system design characteristics influence performance. Using Portland as the model of a successful transit system, we identify three characteristics that are associated with Portland’s success. These characteristics are the transit network’s dispersed nature, the overlay of a higher-speed, high-frequency regional LRT network atop the local bus system, and the use of transfers to provide passengers easy access to a diverse array of destinations. We examine the degree to which the incidence of these characteristics is correlated with positive transit performance in the other four systems: Dallas, Sacramento, Salt Lake City, and San Diego. We find that better metropolitan transit performance is associated with a greater incidence of the three characteristics. We conclude by discussing the implications for planners in designing successful metropolitan transit networks.
Transit Performance in Five LRT New Start Cities
In evaluating the performance of each metropolitan area’s LRT-based regional transit system, we considered both individual mode and total regional performance. We judged a regional transit system to be successful if it met four criteria: high metropolitan area riding habit, high metropolitan area service productivity, high LRT ridership, and high LRT productivity. Metropolitan area riding habit refers to the total number of passenger miles consumed on all fixed-route transit modes in the metropolitan area expressed on a per-person basis (passenger miles per capita). Metropolitan area service productivity refers to the number of passenger miles per revenue mile for all fixed-route modes in each metropolitan area. LRT ridership refers to the number of passenger miles traveled by LRT patrons. LRT service productivity refers to the number of passenger miles per revenue mile for LRT service.
Table 1 provides mode-based and metropolitan area ridership and productivity statistics. The top panel reports LRT ridership, service, and productivity information and expresses LRT ridership and service as percentages of all fixed-route service in each metropolitan area. The panel shows that LRT ridership and service are highest in Portland and San Diego, followed by Dallas. Sacramento and Salt Lake City have much lower LRT ridership and provide much less bus and LRT service than the other three metropolitan areas. In each of the five metropolitan areas, LRT ridership accounts for 30 percent or more of the entire metropolitan area’s transit ridership. The LRT ridership shares range from a low of 30 percent in Dallas to a high of 54 percent in Salt Lake City. LRT service accounts for a much smaller percent of the metropolitan area total than LRT contributes to ridership. LRT accounts for between 13 percent (Dallas) and 27 percent (Sacramento) of metropolitan area transit service. Thus, LRT is carrying a disproportionate share of metropolitan transit ridership, as one would hope. The far right column of the top panel reports LRT productivity. The most productive LRT service is in Salt Lake City, followed by Portland. Sacramento’s LRT system has the lowest productivity.
The middle panels provide the same information about commuter rail services (where applicable) and fixed-route bus service. Particularly striking are the differences in bus route productivity in the five metropolitan areas. Portland has much higher bus productivity (10.32 passenger miles per revenue mile) than the other metropolitan areas. Dallas ranks second, and San Diego is not too far behind. Salt Lake City has the lowest bus productivity (4.34 passenger miles per vehicle mile) of the five metropolitan areas.
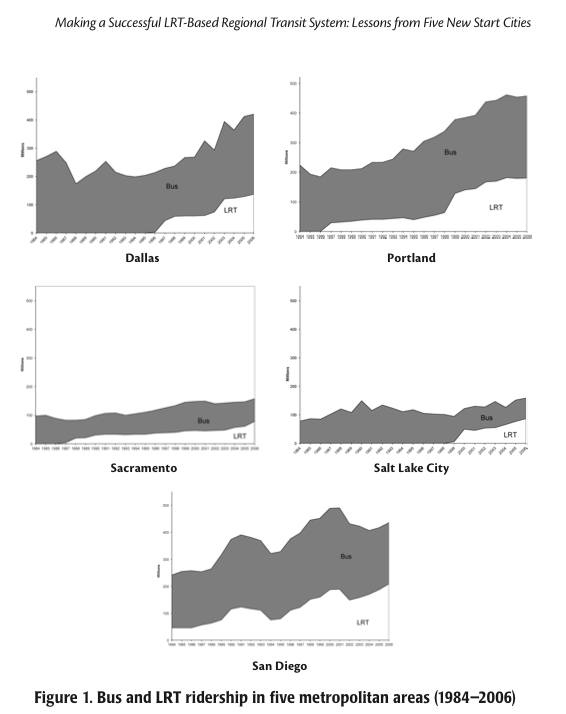
Figure 1 provides a capsule history of bus and LRT ridership over the two decades preceding the data shown in Table 1. Each metropolitan area is shown as a graph panel. The panels all feature the same scale (expressed as millions of passenger miles) and cover the same time period (1984–2006). Bus ridership is shown on top of LRT ridership in each graph.
About the Florida State University Department of Urban & Regional Planning (DURP)
http://www.coss.fsu.edu/durp/
“DURP is Florida’s oldest and largest graduate planning program. Founded in 1965, DURP has been a leader in planning education for decades and shaped planning practice in a state internationally known for innovations in the areas of comprehensive planning, emergency management, land conservation, urban design, public health, and the transportation-land use nexus.”
Tags: Florida State University, LRT, LRT-based regional transit system


 RSS Feed