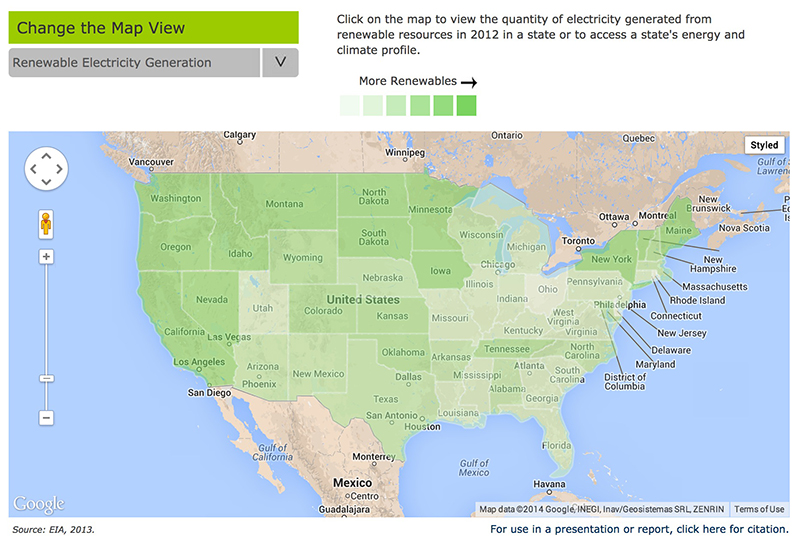
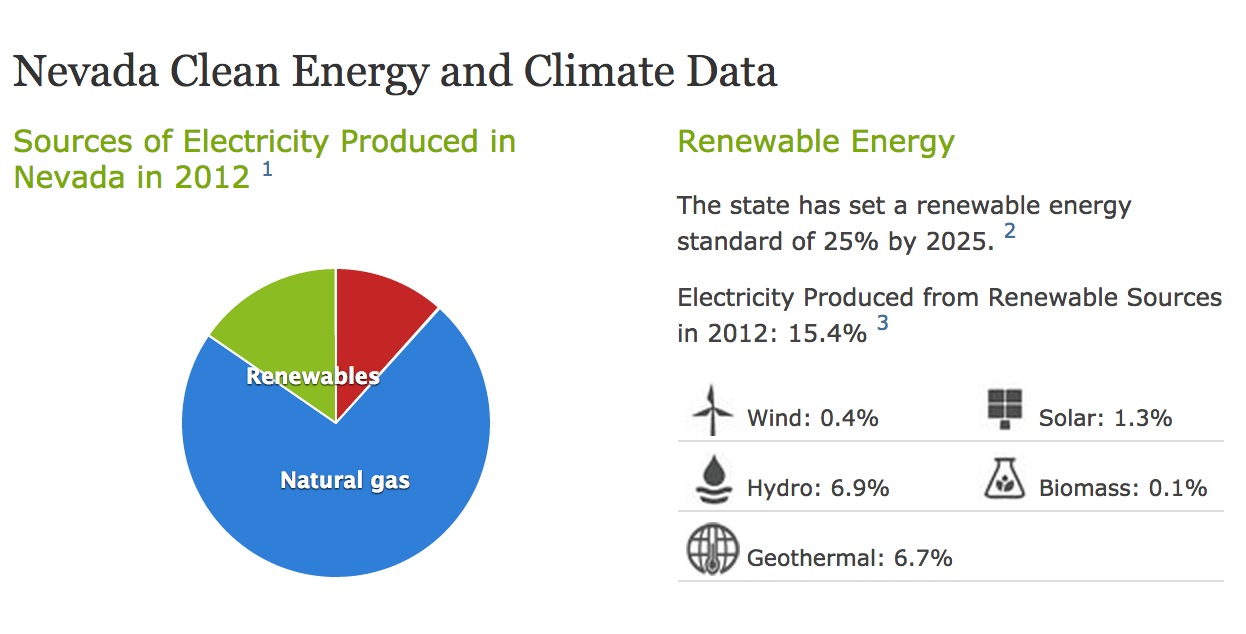
Curious how your state stacks up when it comes to sustainability, renewable energy or climate-friendly policies? The Georgetown Climate Center’s new interactive map includes all these parameters (and much more) in its colorful, easy-to-read interface. With the center’s proprietary State Energy Analysis Tool as the engine, this map offers insight into a wide range of data that’s otherwise hard to come by, from Electricity Market Regulation to Energy Exporters and Importers. State profiles offer an in-depth analysis of each state’s energy/climate breakdown.
Tags: Georgetown Climate Center, Georgetown University, Interactive Map, Natural Gas, Renewables, Solar Energy, Wind Energy


 RSS Feed