View original post (autoinsurancecenter.com)
Despite dozens of new transportation and infrastructure projects underway in the United States and President Trump’s call for new roads and public works, tens of thousands of bridges across the country are currently falling apart.
From Hawaii to Maine and every state in between, Americans today are driving across bridges that are classified as “structurally deficient” (i.e., one or more of the key bridge components – such as the deck, superstructure, or substructure – is considered to be in “poor” condition or worse).
With data from the American Road & Transportation Builders Association (ARTBA), we examined where the busiest structurally deficient bridges are located, how many people cross them each year, when they were originally built, and which states are attempting to make repairs. Is your state home to one of these bridges? Read on to find out.
The Sad State of Bridges
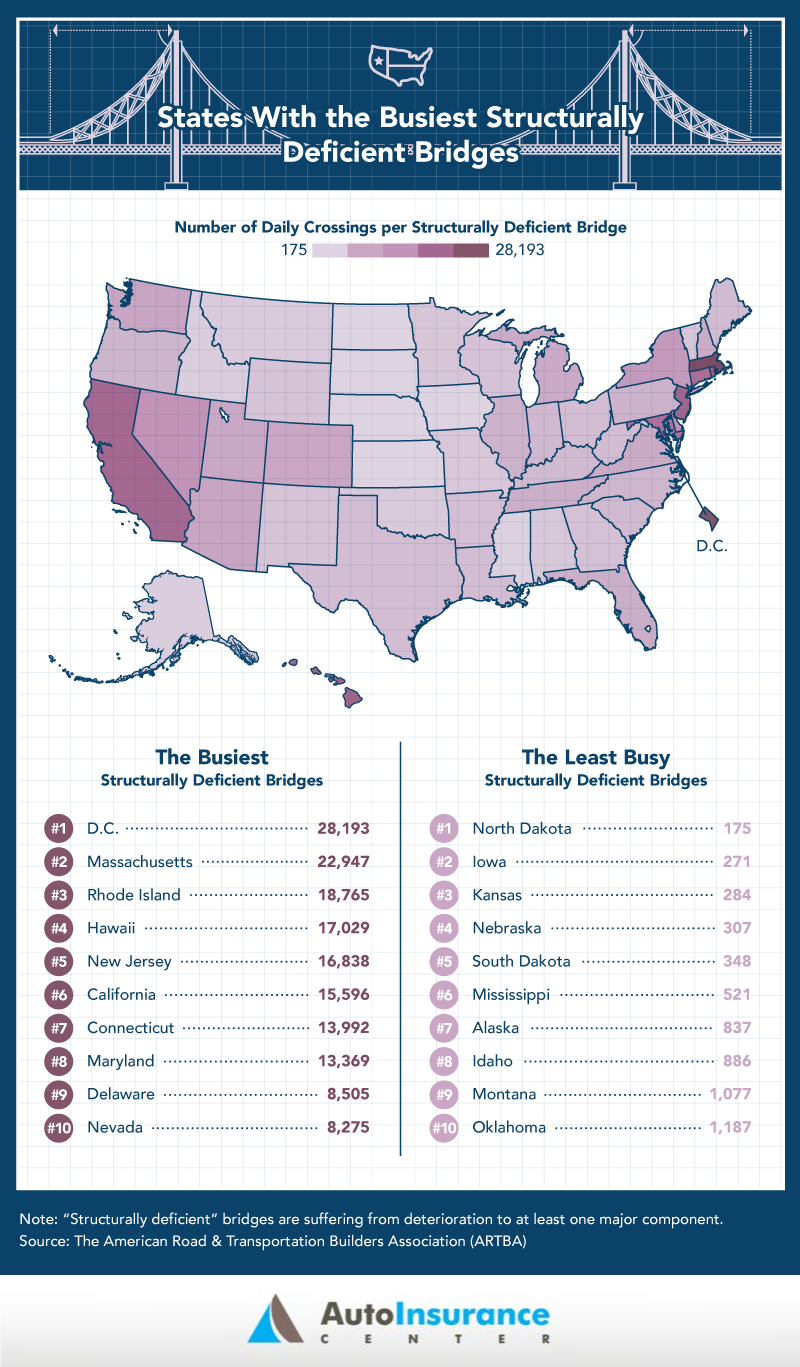
States with not only the most structurally deficient bridges but also the most crossings each day were a top concern. Structurally deficient bridges are suffering from deterioration to at least one major component.
Despite having the fewest number of deficient bridges in the nation, D.C. topped the list with more than 28,000 daily crossings over its structurally deficient bridges. Despite being right outside the buildings where decisions are made about infrastructure projects, the Arlington Memorial Bridge running between the District and Virginia has been a long-standing danger to those driving across it. While emergency repairs were made to the bridge in 2015, it is estimated that roughly $250 million will be needed to fix the overpass entirely.
Massachusetts (nearly 23,000 daily crossings) and Rhode Island (nearly 19,000 daily crossings) also have some of the busiest structurally deficient bridges in the country. Some bridges in Massachusetts – like the East Street Bridge – have become famous for the work they need; however, the East Street Bridge won’t be repaired until November of 2017, despite the numerous crashes that happen there every year.
Hawaii (more than 17,000), New Jersey (nearly 17,000), and California (more than 15,000) also had the most daily crossings over structurally deficient bridges.
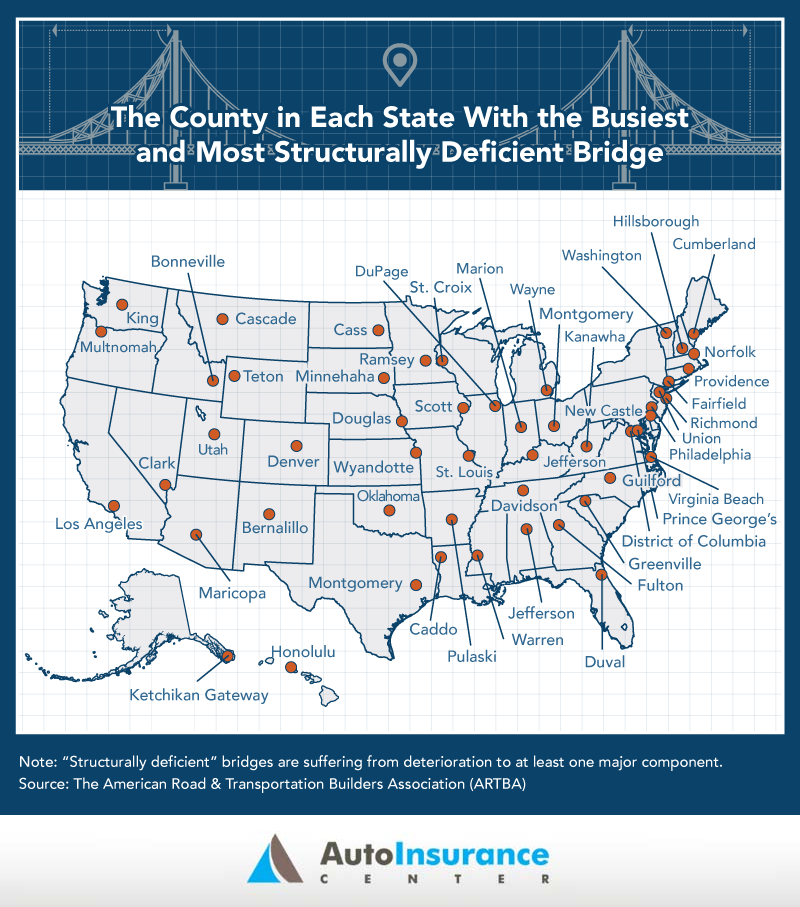
The Most Dangerous Bridges in America’s Counties
States have differing land masses and multiple bridge locations; still, we used ARTBA data to examine which counties have the most traveled structurally deficient bridges. Many Americans have a fear of crossing bridges, but which bridges should we actually worry about?
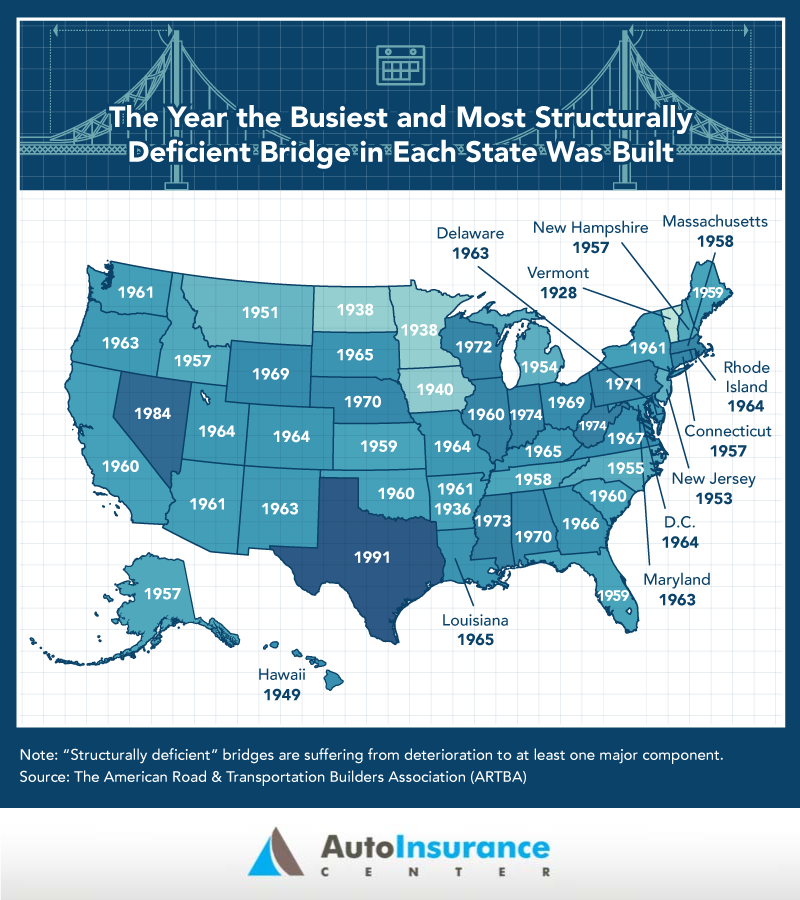
If you’re driving in Florida, you may want to avoid the Fuller Warren Bridge in Jacksonville. The bridge has an average 150,000 crossings each day, but is structurally deficient. It was built in 1959.
Aged Bridges Across the Country
Tags: ARTBA, Auto Insurance Center, infographic, Infographics, safety


 RSS Feed