CENTER FOR SUSTAINABLE DEVELOPMENT
UNIVERSITY OF TEXAS AT AUSTIN SCHOOL OF ARCHITECTURE
by Junfeng Jiao and Aaron Nichols
Introduction
This study builds on previous research that has been done on “transit deserts.” This concept is similar to the popular and thoroughly studied concept of a “food desert,” which is a geographic area where there is no or limited access to fresh food (Clark et al. 2002; Jiao et al. 2012; Whelan et al. 2002; Wrigley 1993; Wrigley et al. 2002). The food desert concept has received a lot of attention and influenced planning policies and practices. By applying the same idea to transit systems within urban areas, geographic areas can be identified where there is a lack of transit service. There are three main steps to this process. This involves identifying the transit dependent populations as a measure of transit demand, calculating the transit supply, and then subtracting the supply from the demand to measure the gap (Jiao & Dillivan 2013).
The transit dependent populations are those who might require transit service to get around more than other people. These are typically people who are too old, too young, too poor, or physically unable to drive (Grengs 2001). The supply is measured by aggregating a number of criteria that contribute to transit supply and, in this case, access to it to receive a measurement of the transit service within a designated geographic area. The demand is subtracted from the supply to find the gap. Transit deserts are areas where the transit demand is significantly greater than the supply.
…
6. Results
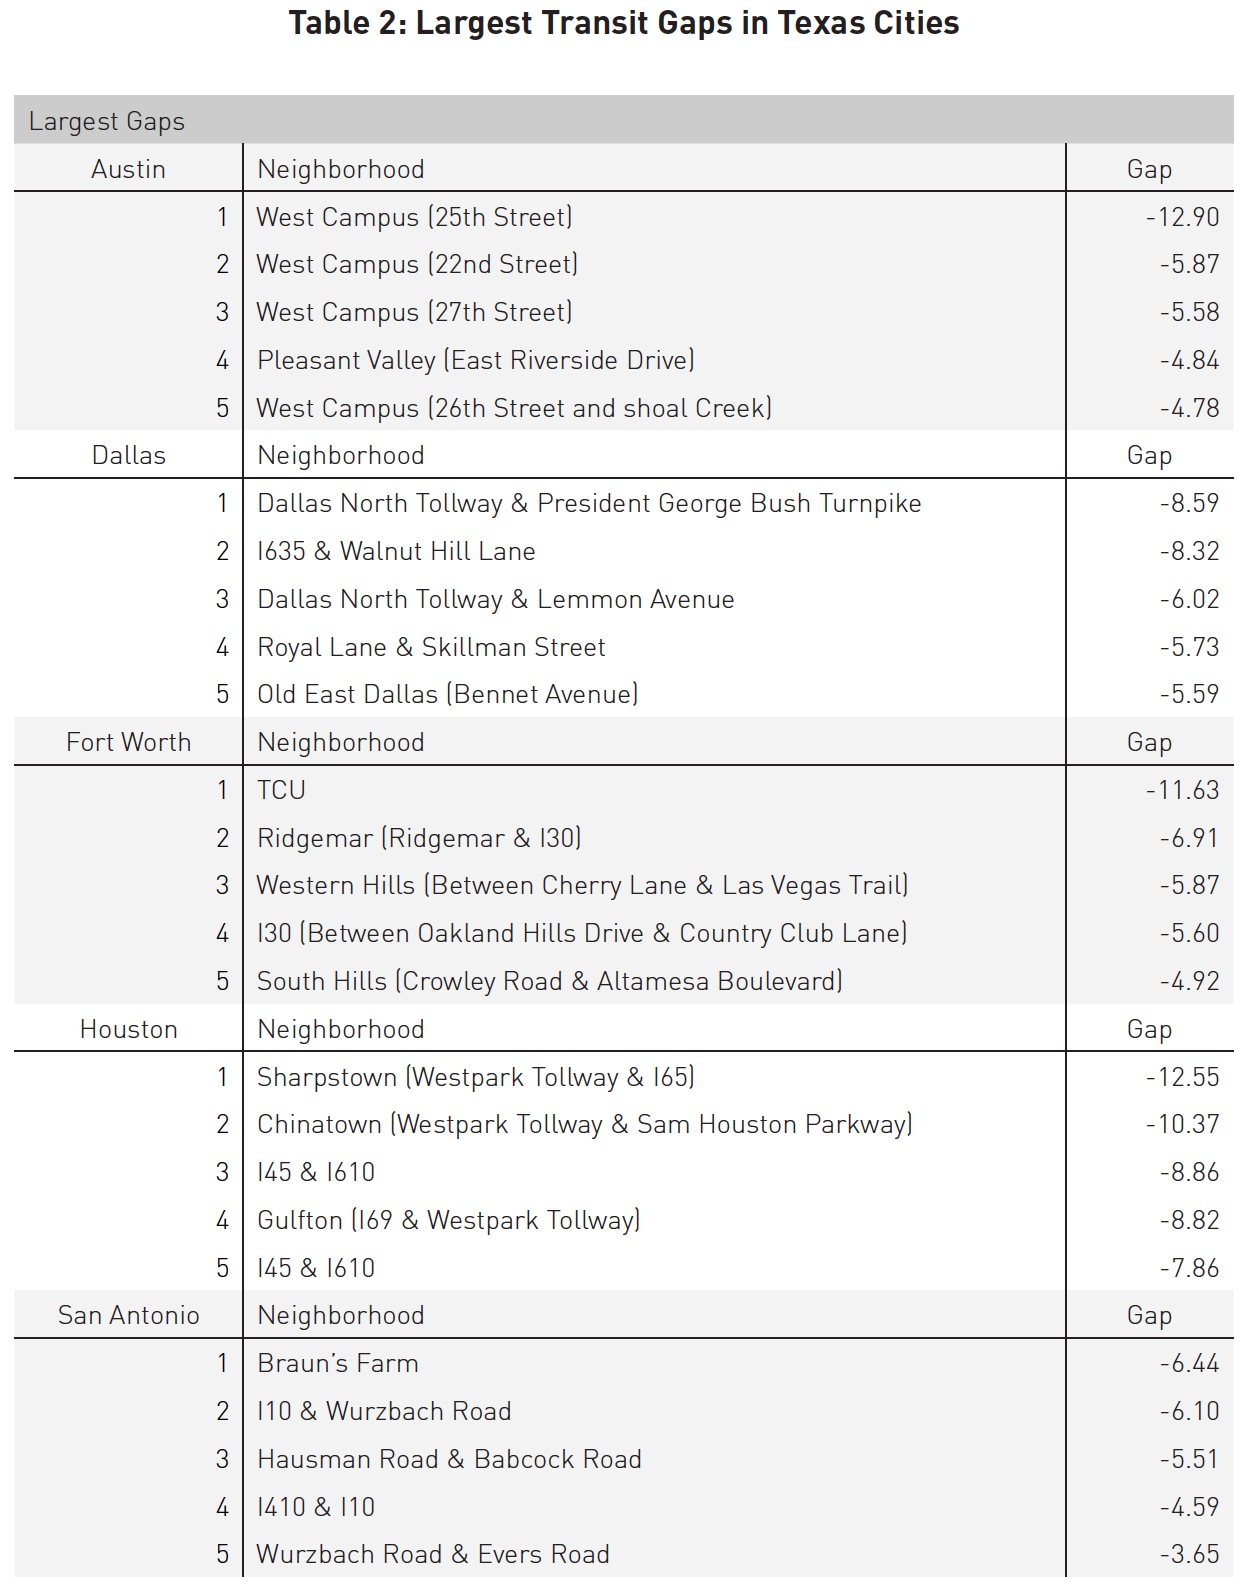
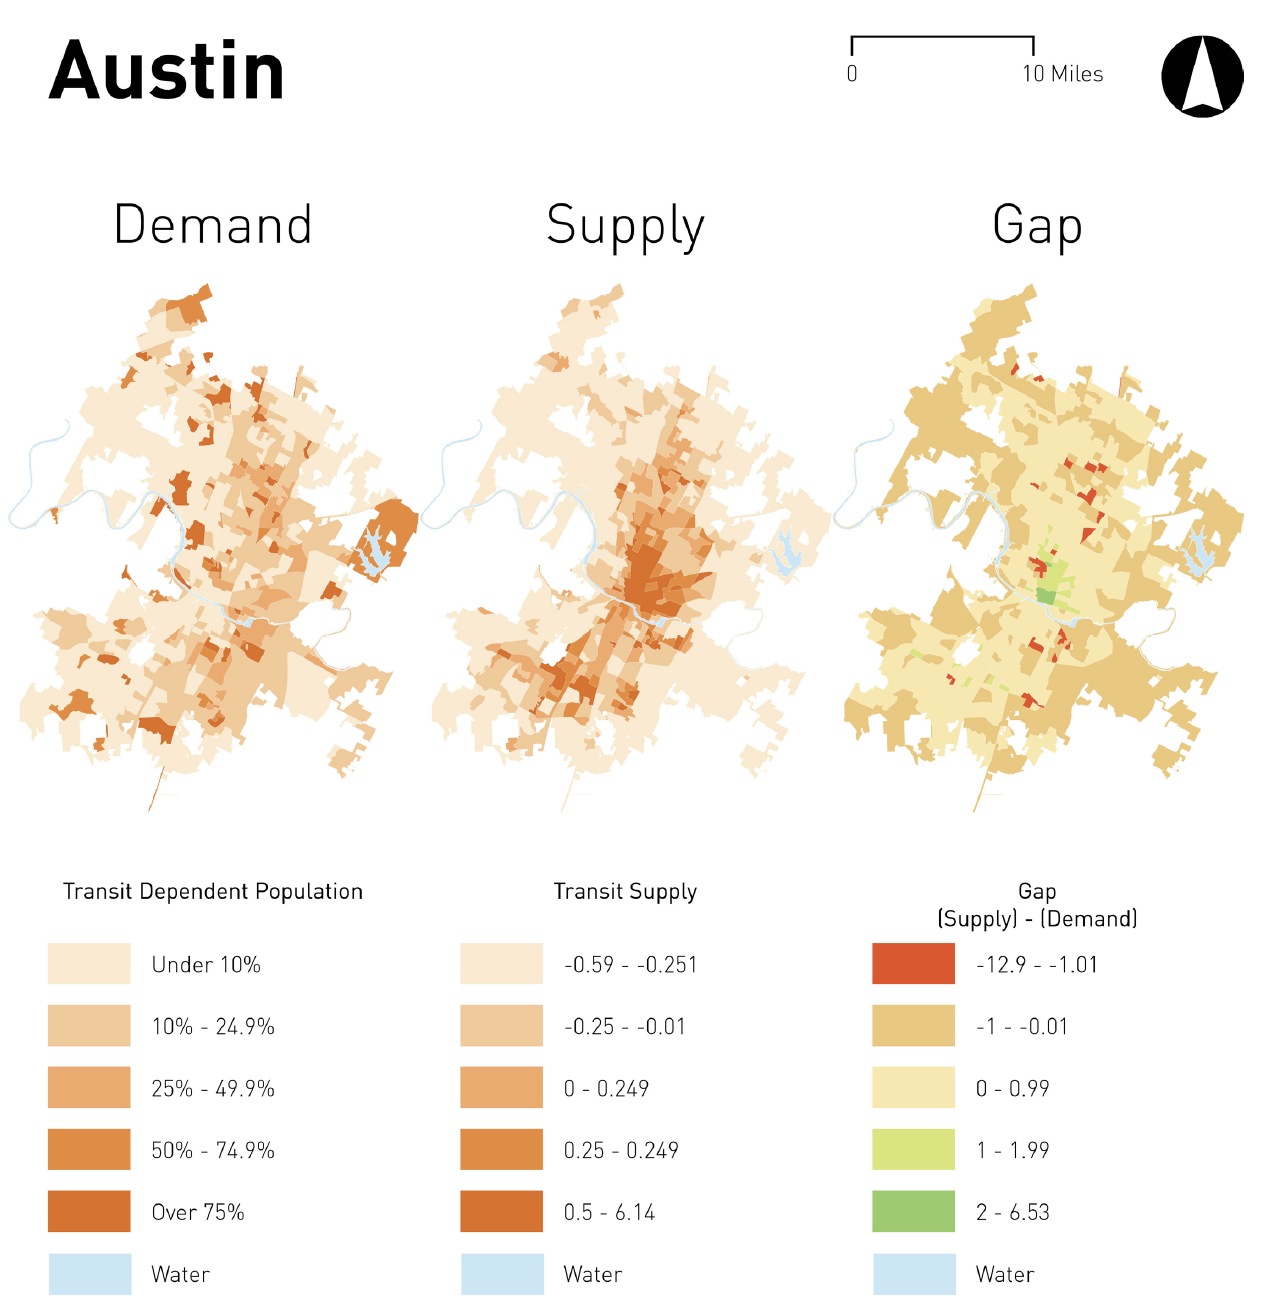
The supply, demand, and gap were calculated for each of the Texas cities and mapped using GIS. There were some differences among the transportation systems for each city. While all of them have some form of bus service and all have some form of rail service, with the exception of San Antonio, others have much more extensive transportation systems. Central Houston has a streetcar service while Austin has a single commuter rail line that connects downtown with the northern suburbs. Dallas has a very extensive light rail system and a commuter train that connects downtown Dallas to downtown Fort Worth. Fort Worth’s only rail service is the commuter train that is shared with Dallas. That being said, the differences in supply and demand within each city could be attributed to the differences in transit services that are available as well as differences in the built environment. Supply, demand, and gap maps for each of the five cities can be seen in figures 1-5.
Measurements of each city’s transit services as well as characteristics of the built environment that were used to calculate the transit supply in each of the Texas cities are summarized in table 1. Out of the five cities that were examined, Houston has the largest population, largest land area, and highest population density. Houston also has the most transit lines and transit stops, but more trips are made within a 24-hour period in San Antonio. Houston also has the highest average weekday ridership out of the transit systems in Texas cities. However, this is not surprising considering that Houston is the most populous city by almost 800,000 people. Houston and San Antonio also have an average intersection density of roughly 102 intersections per square mile. This suggests that the two cities might have similar development patterns.
It is also interesting to compare the transit and built environment characteristics in Austin and Fort Worth. The two cities have comparable populations, with Austin having roughly 90,000 more people, and comparable land areas, with Fort Worth having roughly 40 more square miles. Both cities also have the two lowest intersection densities out of the five Texas cities that were examined and total sidewalk lengths within the two cities are almost identical. However, the two cities have drastically different transit systems and transit use. Both systems are made up of bus lines and a single commuter rail line, but the ridership and the number of trips made within a 24-hour period are drastically different. In Austin, more than twice as many trips are made within a 24-hour period than in Fort Worth. Austin’s average weekday transit ridership is also almost four times higher than Fort Worth’s, which is surprising since Austin’s transit system only makes about 2.5 times more trips than Fort Worth’s and has 1.6 times as many transit lines. The difference in ridership is disproportionate considering the relative sizes of the two cities and transit systems.
Download full version (PDF): Identifying Transit Deserts in Texas Cities
About the Center for Sustainable Development
https://soa.utexas.edu/libraries-centers/center-sustainable-development
The Center for Sustainable Development was founded in 2001 with a mission to lead the study and practice of sustainable development in Texas, the nation, and the world through complementary programs of research, education, and community outreach. The CSD is unique in its integration of diverse interests to develop creative, balanced, achievable solutions to the physical and social challenges facing the planning, construction, and preservation of buildings, neighborhoods, and regions.
Tags: Austin, Center for Sustainable Development, CSD, Dallas, Fort Worth, Houston, San Antonio, Texas, TX, University of Texas at Austin


 RSS Feed