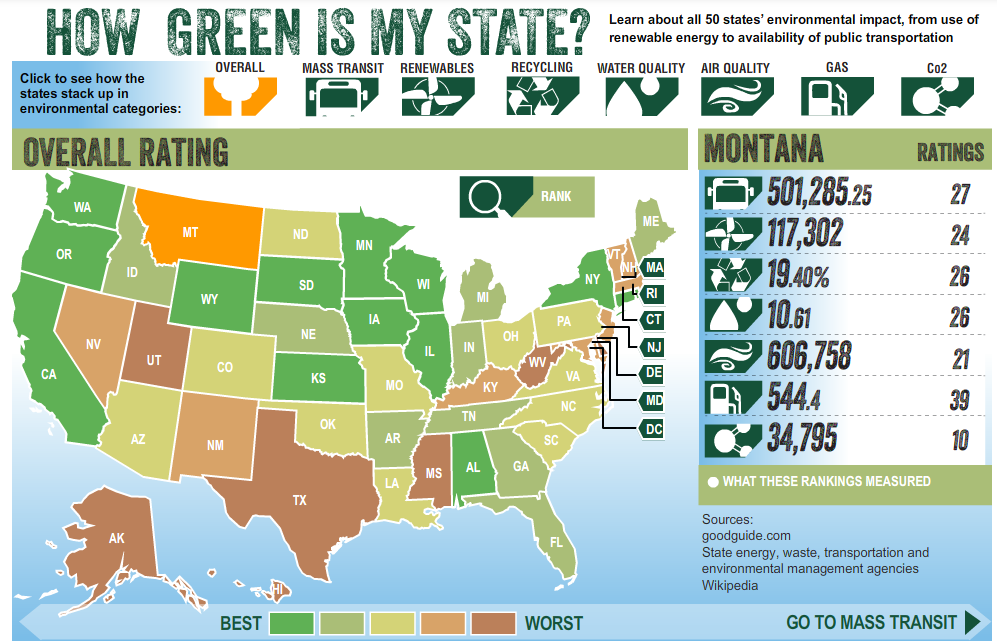
Walking around in your neighborhood, you may see recycling cans on your curb, solar panels on your neighbor’s home, hybrid vehicles in nearby driveways, and mass transit stops just a few blocks away. With all the efforts our communities make to reduce, reuse, and recycle, are other neighborhoods following suit? How about state-wide efforts? MPHonline.com has created a shocking new graphic entitled, “How Green is My State”, which details each states’ use of mass transit, renewables, recycling, water quality, air quality, gas, and Co2 in an easy to read, interactive map. Each state is colored according to their ranking, from best to worst, and with a simple click you can see where your state ranks in comparison with others for each of the areas mentioned above. When clicking on your state, pay attention to where it ranks in easy-to-adopt areas like recycling. Recycling is simple and free (Or even a moneymaker). California ranks #1, with New Jersey in #2. Utah is #51, and Delaware is #50.
View interactive infographic here: How Green Is My State?
Tags: How Green Is My State, infographic, recycling, visual.ly


 RSS Feed