UNITED STATES DEPARTMENT OF ENERGY
Executive Summary
In 2013, 30.4 megawatts (MW) of new distributed wind capacity was added, representing nearly 2,700 units across 36 states, Puerto Rico, and the U.S. Virgin Islands (USVI). Since 2003, nearly 72,000 wind turbines have been deployed in distributed applications across all 50 states, Puerto Rico, and the USVI, totaling 842 MW in cumulative capacity. The 83% decline from 2012 to 2013 of distributed wind capacity additions is in line with the 92% decline from 2012 to 2013 in overall U.S. wind capacity deployed.
To compensate for weaker domestic sales, U.S. small wind turbine manufacturers shifted their focus to growing international markets. Exports from U.S.-based small wind turbine manufacturers increased 70% from 8 MW in 2012 to 13.6 MW in 2013. U.S. small wind turbines were exported to more than 50 countries in 2013, with top export markets identified as Italy, UK, Germany, Greece, China, Japan, Korea, Mexico, and Nigeria. In 2013, 76% of U.S. manufacturers’ new small wind sales capacity went to non-U.S. markets, a substantial increase from 57% in 2012.
The purpose of this report is to quantify and summarize the 2013 U.S. distributed wind market to help plan and guide future investments and decisions by industry, utilities, state and federal agencies, and other interested parties. Distributed wind is defined in terms of technology application based on a wind project’s location relative to end-use and power-distribution infrastructure, rather than on turbine or project size. While the distributed wind market includes wind turbines and projects of many sizes, this report breaks the market into two segments when appropriate: wind turbines up through 100 kW (in nominal capacity) referred to in this report as “small wind,” and wind turbines greater than 100 kW used in distributed applications.
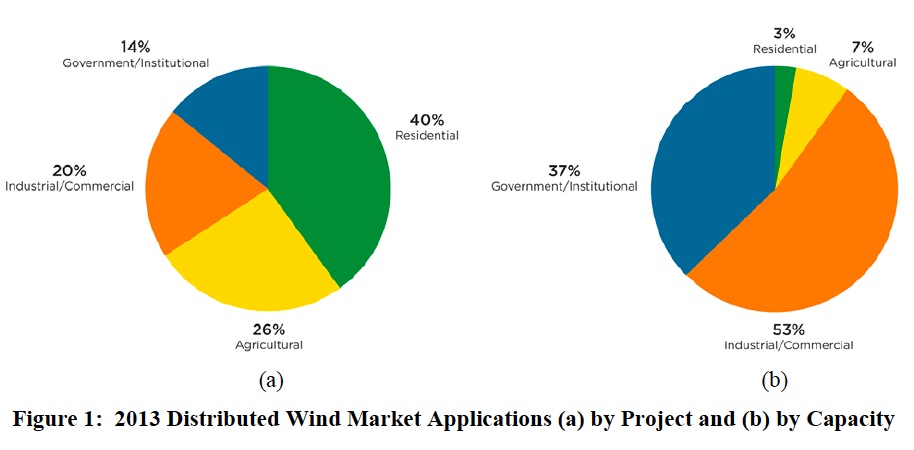
Residential applications accounted for 40% of U.S. distributed wind deployed in 2013, followed by agricultural for 26%, industrial and commercial for 20%, and government and institutional for 14% on a per project basis. Off-grid small wind turbine models continue to account for the bulk of wind turbine units deployed in U.S. distributed wind applications, but wind turbines connected to the distribution grid, or “grid-tied” applications, accounted for more than 97% of the annual domestic distributed wind capacity (in terms of MW).
U.S. suppliers continued to dominate the domestic market for small wind, claiming 93% of 2013 domestic small wind sales on a unit basis. On a capacity basis, U.S. suppliers claimed 88% of 2013 domestic small wind capacity, up from 86% in 2012. The 2013 combined U.S. market for new and refurbished small wind turbines accounted for $36 million in investment from nearly 2,700 units sold; however, this represented a 70% decline in capacity from 18.4 MW in 2012 (3,700 units and $101 million in investment) to 5.6 MW in 2013.
Reported 2013 U.S. distributed wind deployments of all sizes encompassed 69 different wind turbine models ranging from 100 watts (W) to 2 MW from 38 suppliers with a U.S. sales presence. Eight of the top ten models of all 2013 wind turbines deployed in U.S. distributed applications (on a unit basis) were manufactured by suppliers headquartered in the United States.
Of the 30.4 MW of distributed wind capacity deployed in 2013, nearly 82% (24.8 MW) is from 9 projects using turbines greater than 100 kW, for a total of 18 units, in Colorado, Kansas, Ohio, Massachusetts, Alaska, Indiana, North Dakota, and Puerto Rico. Nevada, Iowa, Minnesota, Oklahoma, New York, Texas, and Hawaii led the nation for 2013 small wind sales. Texas, Minnesota, and Iowa retained their positions as the top three states with the most distributed wind capacity deployed since 2003. Iowa, Nevada and California remained the leading states for cumulative small wind capacity. A total of 14 states now have more than 10 MW each of distributed wind capacity.
A total of $15.4 million in federal, state, and utility incentives were awarded to distributed wind projects in 2013, but significant imbalances between solar and distributed wind incentive funding levels exist in several states. This total amount contrasts strongly to 2012 during which over $100 million in such incentives were awarded. With respect to the discrepancy between solar PV and distributed wind funding at the state level, New Jersey provides a strong example with $363 million of awards to solar PV projects compared to $6 million to distributed wind projects since 2003.
Download full version (PDF): 2013 Distributed Wind Market Report
About the United States Department of Energy
www.energy.gov
The mission of the Energy Department is to ensure America’s security and prosperity by addressing its energy, environmental and nuclear challenges through transformative science and technology solutions.
Tags: U.S. DOE, United States Department of Energy, Wind Energy


 RSS Feed