SMART GROWTH AMERICA
NATIONAL COMPLETE STREETS COALITION
Executive Summary
 Between 2008 and 2017, drivers struck and killed 49,340 people who were walking on streets all across the United States. That’s more than 13 people per day, or one person every hour and 46 minutes. It’s the equivalent of a jumbo jet full of people crashing—with no survivors—every single month.
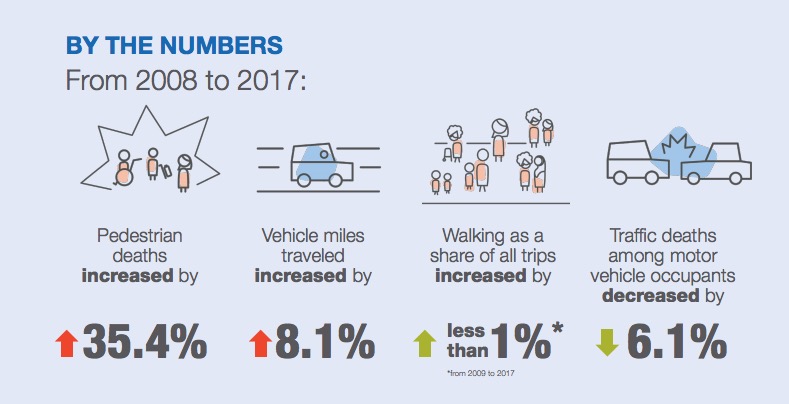
In the past decade, the number of people struck and killed while walking increased by 35 percent. 2016 and 2017 were the two highest years since 1990 for the number of people who were killed by drivers while walking.
This report ranks states and metropolitan areas around the country using our “Pedestrian Danger Index”, or PDI. This index measures how deadly it is for people to walk based on the number of people struck and killed by drivers while walking, controlling for the number of people that live in that state or metro area and the share of people who walk to work. The 2019 edition of Dangerous by Design includes traffic deaths that occurred between 2008 and 2017 from the Fatality Analysis Reporting System (FARS), a national database of all fatal traffic crashes.
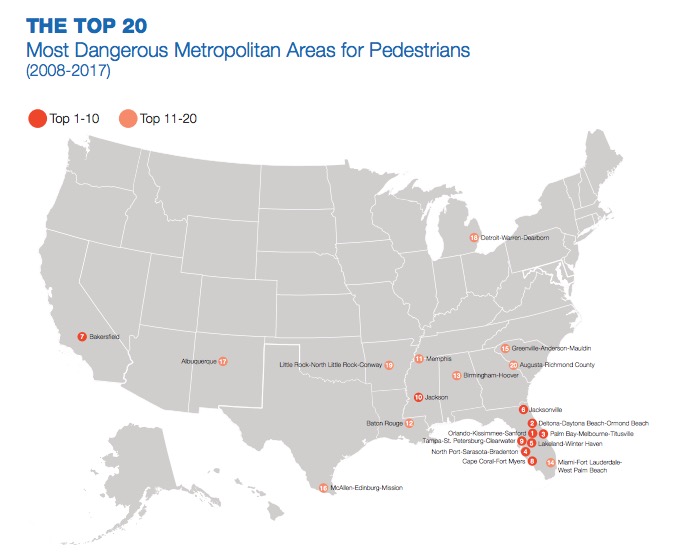
What this report shows is that our streets aren’t getting safer. Even more so, while traffic deaths impact every community in the United States, states and metropolitan areas across the southern continental United States, older adults, people of color, and people walking in low-income communities bear a higher share of this harm.
Why is this happening? We’re not walking more, and we’re only driving slightly more than we were back in 2008. What is happening is that our streets, Federal funds, policies, and standards helped to create this problem and have a role in improving the streets we build tomorrow. which we designed for the movement of vehicles, haven’t changed. In fact, we are continuing to design streets that are dangerous for all people. Furthermore, federal and state policies, standards, and funding mechanisms still produce roads that prioritize high speeds for cars over safety for all people.
To reverse this trend and save lives, we need to protect all users of the transportation system through our policies, programs, and funding.
Our federal government needs to take the lead on prioritizing safer streets. Federal dollars and policies helped create these unsafe streets in the first place. And federal funds, policies, and guidance have a significant role to play in fixing these streets and in designing the streets we’ll build tomorrow.
We call on Congress to adopt a strong, federal Complete Streets policy that requires state departments of transportation (DOTs) and metropolitan planning organizations (MPOs) to consistently plan for all people who use the street, including the most vulnerable users.
We call on state DOTs and MPOs to put people first and give their organizations the tools and training they need to create transportation networks that serve all users.
We call on the over 1,400 communities that have adopted a Complete Streets policy to turn their vision into practice and implementation.
And we call on you to demand safer streets from the elected officials in your communities.
Introduction
 Between 2008 and 2017, drivers struck and killed 49,340 people while they were walking throughout the United States.1 That’s more than 13 people per day, or one person every hour and 46 minutes. It’s the equivalent of a jumbo jet full of people crashing—with no survivors—every single month.
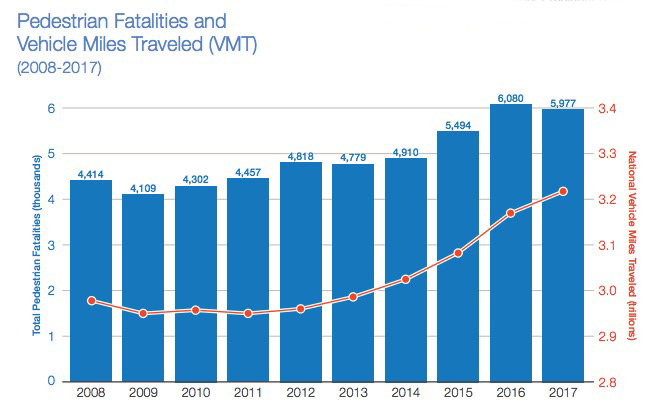
Unlike traffic fatalities for motor vehicle occupants, which decreased by 6.1 percent from 2008 to 2017, pedestrian deaths have been steadily rising since 2009. In 2015, 5,494 people died while walking, an unprecedented increase of 11.9 percent compared to the previous year. In 2016, pedestrian deaths rose by another 10.6 percent to 6,080. Deaths declined slightly in 2017 to 5,977, but this is nothing to celebrate—it’s still the second highest body count on record since 1990.
Why Is This Happening?
ARE WE WALKING MORE? Not really. Although individual cities and metropolitan areas have observed increased walking rates, the share of trips made by walking nationwide barely increased from 2009 to 2017 according to the National Household Travel Survey, and the total number of all trips, including walking trips, decreased during this time.
ARE WE DRIVING MORE? Vehicle Miles Traveled (VMT), or the total amount of driving we do as a nation each year, has gradually increased since 2011. However, as shown in the chart on the previous page, VMT in 2017 was only 8.1 percent higher than it was in 2008 before the economic recession, but the number of people struck and killed by drivers while walking rose by more than a third during this time period and is higher now than it’s been in nearly three decades.
What’s Going Wrong?
We continue to design streets that are dangerous for all people, not just because we keep repeating the same mistakes, but because our federal policies, standards, and funding mechanisms that have been in place for decades produce dangerous roads that prioritize high speeds for cars over safety for all people.
Additionally, more people are driving cars that the National Highway Traffic Safety Administration (NHTSA) has determined to be notoriously dangerous for people walking. According to a 2015 NHTSA report, SUVs (sport utility vehicles) and pickup trucks are two to three times more likely than smaller personal vehicles like sedans to kill people walking in the event of a crash. A recent Detroit Free Press article observed that SUV sales have climbed steadily since 2012, surpassing sedans as the best-selling type of vehicle nationwide as of 2014.
This year, Congress has a major opportunity to reshape our mobility future as they begin the work of reauthorizing our federal transportation bill in 2020. To address our continuing safety problems, they must create policies that change the way we fund, design, and measure the success of our streets nationwide to make sure the safety of all people who use the street including people walking, is our highest priority
We need a strong federal Complete Streets policy that requires state departments of transportation to consistently plan for all people who use the street, including the most vulnerable users. Federal policy must also open the door for flexible guidance to allow planners and engineers to make innovative decisions about how to design roadways to accommodate all users. We need performance measures that ensure states set targets that require progress toward creating safer streets and hold them accountable for achieving reductions in serious injuries and fatalities, penalizing them for failing to meet those targets. And we also need more high quality data on the street conditions where fatalities occur and on traffic-related injuries nationwide to help us better diagnose and solve the problem.
Funding is a first step. But not the last. As long as the federal government continues to invest the lion’s share of our transportation funding in building, maintaining, and widening streets for cars instead of creating safer streets for people, we will continue to see more people being killed while walking. National policy must reflect safety as a higher priority. This will result in the reallocation of our current spending to invest in safety for all users and help to establish dedicated funding programs for projects to support walking, biking, transit, and other modes of transportation.
Emerging technologies such as automated vehicles (AVs) aren’t the answer either. These technologies are not going to solve our safety problems for us, especially not when it comes to the safety of people walking. AVs may not always be able to reliably detect people walking and biking. Additionally, under pending federal legislation, states and cities will have little to no oversight over how these technologies are deployed within their own communities.
We must make preventing traffic deaths a higher priority nationwide, including for people walking. Of all the people that die in traffic crashes on our roads, people walking now comprise 16.1 percent of all deaths, and as shown above, that share has been consistently growing for more than a decade.8 Better, faster trauma care and safety improvements for occupants of vehicles ranging from seatbelts to automatic braking and lane departure warnings have played an important role in saving lives on our roadways overall. However, the safer street and vehicle design standards needed to protect people walking have progressed slowly or not at all.
This report ranks the most dangerous states and metropolitan areas across the United States for people walking. It also exposes disparities in which groups of people are most at risk of dying while walking.
Traffic deaths impact every community in the United States, but states and metropolitan areas across the southern continental United States, older adults, people of color, and people walking in low-income communities bear a higher share of this harm.
It is our hope that this report will inspire communities across the country to take action. Policymakers at the federal, state, and local level can and should do more to ensure streets are designed and operated to protect the safety of all people who use them regardless of age, ability, income, race, ethnicity, or mode of transportation.
Download full version (registration required): Dangerous by Design 2019
About Smart Growth America
https://smartgrowthamerica.org/
Smart Growth America advocates for people who want to live and work in great neighborhoods. We believe smart growth solutions support thriving businesses and jobs, provide more options for how people get around and make it more affordable to live near work and the grocery store. Our coalition works with communities to fight sprawl and save money. We are improving lives by improving communities.
Tags: National Complete Streets Coalition, Pedestrian, safety, Smart Growth America


 RSS Feed