CENTER FOR AN URBAN FUTURE
 In the last six weeks alone, flash flooding shut down streets in Park Slope and Williamsburg, a software glitch brought subway trains to a halt during rush hour, a massive power outage left tens of thousands of city residents in the dark, and a Long Island City subway station was deluged with so much water that it knocked a straphanger off his feet. Though hardly at the same scale of infrastructure woes New York City experienced in New York in the 1980s—when the city closed the Williamsburg Bridge for fear of collapse, and track fires were a regular occurrence in the subway system—the recent wave of breakdowns is a troubling reminder of what can happen in a city where a large segment of the core infrastructure is decades old and overdue for basic upgrades.
In March 2014, the Center for an Urban Future documented an array of challenges and vulnerabilities resulting from the city’s aging infrastructure. Our report, titled Caution Ahead, revealed that many of the city’s roads, bridges, subway signals, water and sewer mains, and public buildings were more than 50 years old and in varying states of disrepair. And it identified a minimum investment of $47.3 billion over the next five years to bring the city’s core infrastructure to a state of good repair.
The events of the past month make it clear that the city’s aging assets still present a massive infrastructure challenge. If anything, the need has only been magnified as a result of unprecedented usage from a growing population and record tourism, and new stresses brought on by climate change.
This study provides a five-year update to our assessment of New York City’s aging infrastructure vulnerabilities. It concludes that the de Blasio administration’s record infrastructure investments have resulted in real progress in several areas, but also finds that capital needs across many city agencies have grown significantly—and not just in high-profile areas like the subways and NYCHA. Our new analysis shows that some of the problems we documented five years ago have only gotten worse, and that the new stressors like climate change have only added to the overall price tag to bring the city’s core infrastructure to a state of good repair.
Key Findings
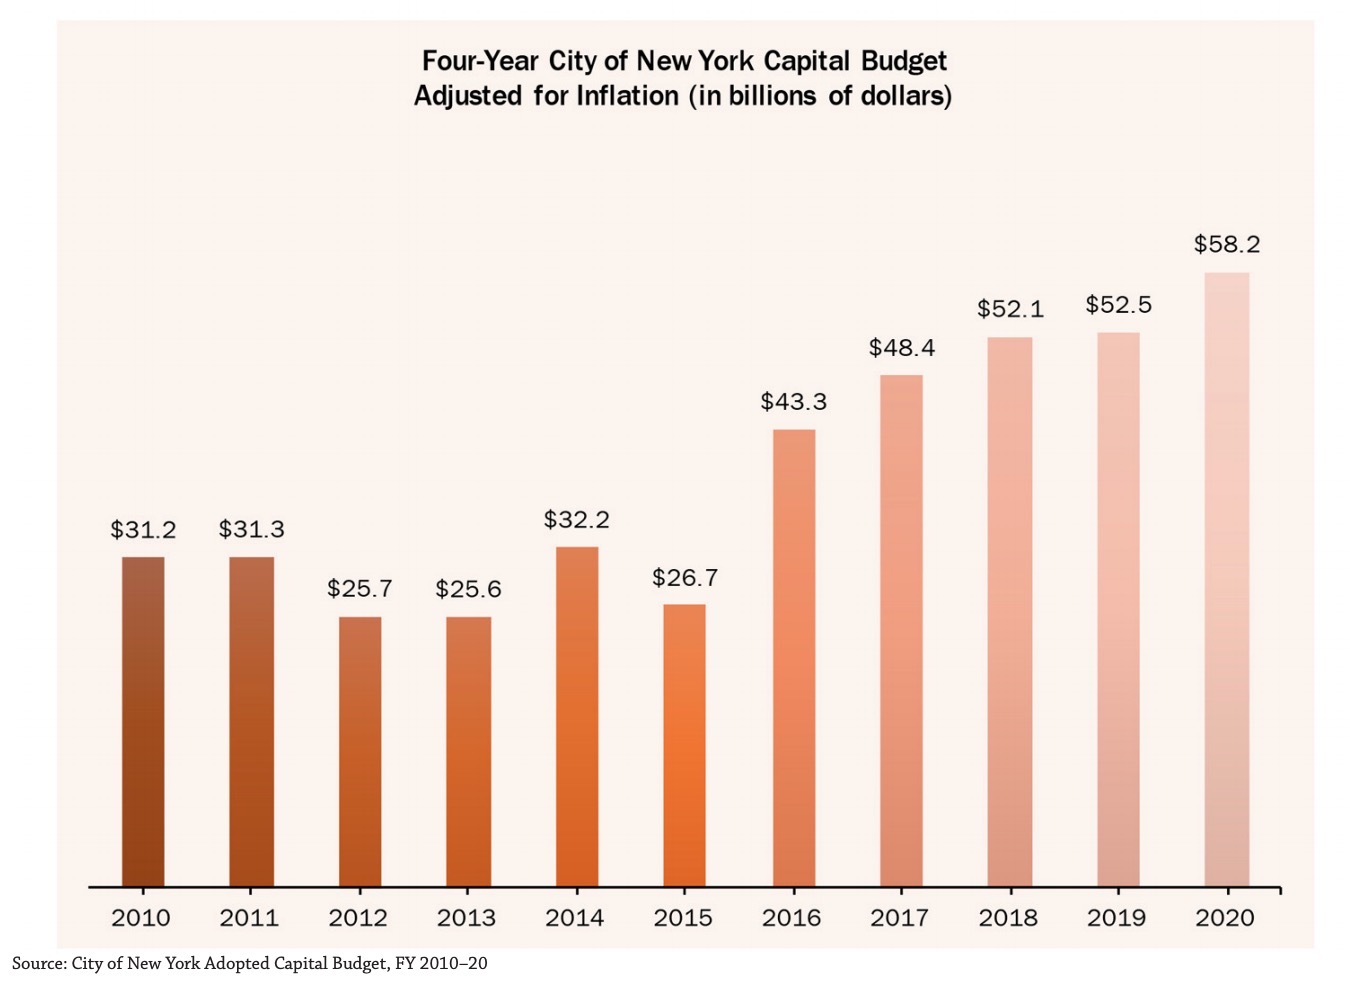
- Over the past five years, Mayor Bill de Blasio and the City Council have significantly increased four-year capital funding, from $26.7 billion in FY 2015 to an unprecedented $58.2 billion in FY 2020, adjusted for inflation.
Increased capital investment—particularly in water and sewer infrastructure and street resurfacing—is beginning to show results. Our analysis finds that the following areas have shown signs of improvement since 2014:
- The city has accelerated its repair and replacement of aging water mains. In FY 2018 alone, 92.6 miles of water mains were upgraded, up from just 19.1 miles in FY 2010.
- The NYC Department of Environmental Protection (DEP) constructed or reconstructed 22.6 miles of sewers in FY 2017 and 25.6 miles in FY 2018, recording the highest mileage totals in a decade.
- The pace of street resurfacing has increased. Between FY 2014 and FY 2018, the city resurfaced an average of 1,182 lane miles per year—up from an average of just 852 miles per year between 2000 and 2013.2
But in other areas, conditions have gotten worse as needs have grown:
- The estimated state-of-good-repair needs at the eighteen city agencies analyzed in our original 2014 report have ballooned, increasing by 19 percent—from $6.6 billion for FY 2014–17 to $7.8 billion for FY 2018–21.
- While city funding has also increased during this period, fourteen of the eighteen agencies still have less than 40 percent of their four-year state-of-good-repair needs funded.
- Five city agencies have less than 20 percent of their four-year state-of-good-repair needs funded.
- Six agencies have a state-of-good-repair needs gap of at least $100 million. The NYC Department of Education (DOE) alone recorded a gap of over $1.5 billion, while the Parks Department had a gap of over $500 million.
- Capital needs at the DOE have nearly doubled since 2011, with four-year state-of-good-repair needs for city schools increasing from an inflation-adjusted $1.1 billion in 2011 to $2.1 billion in 2017.
- Planned spending at the DOE has not kept up with escalating repair needs, leading to a shortfall that has grown from an inflation-adjusted $865 million in 2011 to over $1.5 billion in 2017.
- CUNY’s four-year state-of-good-repair needs for 2017 topped $100 million, more than double the inflation-adjusted $47.6 million reported in 2011.
- New York City Housing Authority (NYCHA)’s overall five-year capital needs increased over 70 percent to $31.8 billion in 2017, up from $18.3 billion in 2011 (adjusted for inflation).
There are also areas of city infrastructure that are seeing improvement, but which still face enormous challenges:
- Although the city has ramped up the pace of water main replacement, there were still 522 water main breaks last year—the highest total in over a decade.
- New York City’s bridges also show mixed results. The number of structurally deficient bridges—those in need of substantial maintenance and repair—has declined from 162 in 2013 to 142 in 2018,6 but the number of bridges that are also fracture critical—at risk of partial collapse—jumped from 47 in 2012 to at least 67 in 2018.
The pages that follow go into significantly more detail about the city’s current infrastructure needs. Throughout our analysis, we find that the decisions made by Mayor de Blasio and the City Council to significantly increase the city’s capital investments are paying off and putting the city’s core infrastructure on stronger footing. But it is also evident that current investment levels will need to be sustained, not only to make up for decades of underinvestment but also to keep pace with increasing usage and new stresses. Doing so will be essential to keeping New York City a global leader into the twenty-first century.
Streets
- New York City’s streets, roads, and highways serve far more than cars. They allow buses, bicyclists, and pedestrians to get around the city, and enable the transport of goods and the activity of first responders, all while protecting vulnerable underground infrastructure and guiding rainwater to catch basins. Yet over the past two decades, city streets have experienced significant deterioration. However, some progress has been made since 2014.
- Between FY 2000 and FY 2013, New York City met its resurfacing goal of 1,000 lane miles per year in only three years (FY 2009, FY 2011, and FY 2012).
- Since 2014, the pace of street resurfacing has increased. The de Blasio administration set a new internal goal of 1,300 lane miles per year, which the city reached for the first time in FY 2017.
- In the past five years (FY 2014–18), an average of 1,182 lane miles have been resurfaced per year. The city surpassed the mayor’s 1,300 lane-mile benchmark in FY 2017 and FY 2018, and is on track to do the same in FY 2019.
- However, the number of lane miles reconstructed each year has fallen significantly over the past decade. From FY 2014 to FY 2018, the city reconstructed an average of 31.3 miles of street lanes per year, down from an average of 38.7 miles per year from FY 2010–13 and just half of the 62 lane miles per year, on average, that the city reconstructed from FY 2006–09.9 This is noteworthy because simply resurfacing streets is often inadequate to keep New York’s well-trafficked roads in good condition over the long run. Deterioration can reach below the road surface and affect the foundation. When this base structure is damaged, new asphalt will not last as long as it would otherwise, necessitating more frequent paving. Repairing the foundation requires replacing the roadway down to a foot or more below the street’s surface and usually includes reconstruction of the curbs and sidewalks as well.
- Today, 28.6 percent of New York City’s street lanes are in “fair” condition, meaning street surface distress (cracking) is clearly visible, or “poor” condition, meaning distress is frequent and severe. That’s an improvement from 2013, when 30.4 percent of roads were rated fair or poor. However, street ratings remain significantly below the level recorded in 2000, when 15.7 percent of streets were assessed fair or poor.
- Highway conditions have improved in recent years. Since 2012, the share of highway lanes rated fair or poor has decreased in every borough. Staten Island saw the greatest improvement, going from 60 percent of lanes rated in fair or poor condition in 2012 down to just 18 percent of lanes in 2017.
- Although every borough has seen improvements in highway conditions since 2012, the conditions in two boroughs—the Bronx and Manhattan—remain worse than in 2008. Manhattan now fares the worst of any borough, with 44 percent of highway lanes rated fair or poor in 2017, up from just 28 percent in 2008.
Bridges
New York City is an archipelago crisscrossed by rivers, creeks, canals, and estuaries, train tracks, highways, parks, and roads. The city’s 1,444 bridges are essential to how the city functions, connecting transportation routes, neighborhoods, and boroughs. But they’re also aging rapidly, and many are now used in ways for which they were never designed.
- The city’s 1,444 bridges are 68 years old on average, with 210 bridges built more than a century ago.
- 1,175 bridges (81.4 percent) are at least 50 years old; 552 are at least 75 years old.
- The number of bridges across the city assessed by the New York State Department of Transportation (NYSDOT) as “structurally deficient” has declined from 162 in 2012 to 142 in 2018, a clear sign of progress.
- The Bronx has the greatest number and highest percentage of structurally deficient bridges, at 51 (16 percent). That’s roughly the same number as in 2012, when 52 bridges in the borough were determined to be structurally deficient.
- Since 2012, the average condition rating of NYC’s bridges is relatively stable, dropping from 4.98 to 4.97 on the seven-point scale used by NYSDOT.
- While fewer bridges are structurally deficient, the number of bridges that are fracture critical— the most pressing issue—has increased significantly, from 47 in 2012 to 67 in 2018.14 Bridges that are fracture critical are those which have a tension member, such as a cable, truss, or bracing whose failure would probably cause part or all of the bridge to collapse.
View full report online (nycfuture.org): Caution Ahead – 5 Years Later
About the Center for an Urban Future
nycfuture.org
The Center for an Urban Future (CUF) is a catalyst for smart and sustainable policies that reduce inequality, increase economic mobility, and grow the economy in New York City. An independent, nonpartisan policy organization, CUF uses fact-based research to elevate important and often overlooked issues onto the radar of policymakers and advance practical solutions that strengthen New York and help all New Yorkers participate in the city’s rising prosperity.


 RSS Feed