Infra Views

Army Corps of Engineers: Efforts to Assess the Impact of Extreme Weather Events

Tuesday, July 28th, 2015
U.S. Army Corps of Engineers’ Systematic, National Infrastructure Risk Assessments, 2006- June 2015

UNITED STATES GOVERNMENT ACCOUNTABILITY OFFICE
The Corps plans, designs, and constructs water resources infrastructure, such as dams and levees. According to the U.S. Global Change Research Program, the frequency and intensity of extreme weather events are increasing. Much of the Corps’ infrastructure was built over 50 years ago and may not be designed to operate within current climate patterns, according to the U.S. Geological Survey.

View this complete Infra Views post...

Funding Transit in St. Louis

Monday, July 27th, 2015
St. Louis, MO

TRANSPORTATION FOR AMERICA
The St. Louis region has done substantial planning to identify key transit projects that will offer more transportation options, improve access to opportunity and attract talent — and the thousands of jobs now relocating to be near that talent nationally. The region has also instituted local sources of transit funding and has utilized those sources to expand transit in advance of further state or federal funding. However, without the identification of a new source(s) of funding, the region cannot move forward with any major expansion to their transit network.

View this complete Infra Views post...

A Funding Compromise Can Set Transportation on Path Toward Sustainability

Friday, July 24th, 2015

NATIONAL CENTER FOR SUSTAINABLE TRANSPORTATION
Against the backdrop of continuing uncertainty around Congressional passage of a new federal transportation bill, a number of proposals have been circulated in the past year to address aspects of securing or reforming state and federal transportation funding. This white paper assembles the most prominent of these proposals and reviews them in the context of sustainable transportation, in particular, these three dimensions: funding sustainability, environmental sustainability, and social justice.

View this complete Infra Views post...

Washington, DC: Grinding to a Halt

Thursday, July 23rd, 2015
Figure 1. Nonattainment with current (75 ppb) and proposed (65 ppb) ozone standards.

UNITED STATES CHAMBER OF COMMERCE
As Congress gears up to debate reauthorization of surface transportation programs, this report is intended to call attention to a significant emerging threat to addressing the aforementioned transportation challenges: the Environmental Protection Agency’s (EPA) forthcoming ozone national ambient air quality standards (NAAQS). This report analyzes the impact of these regulations on transportation projects, with a focus on the Washington, D.C. metropolitan area.

View this complete Infra Views post...

Communications Infrastructure: Enabling the Clean Energy Economy

Wednesday, July 22nd, 2015
Communications Infrastructure - BlueGreen Alliance Infographic

BLUEGREEN ALLIANCE

View this complete Infra Views post...

Washington, DC: State of the Region – Infrastructure Report

Tuesday, July 21st, 2015
15 Year Infrastructure Funding Gaps

METROPOLITAN WASHINGTON COUNCIL OF GOVERNMENTS
The metropolitan Washington region’s leaders have recognized the fundamental role infrastructure plays in the ability to maintain and improve the region. However, despite regional recognition of the importance of maintaining our infrastructure, infrastructure investment is often a challenge for many organizations. Officials at the federal, state, and local level must balance an enormous number of funding needs, and sufficient funds often are not available for infrastructure needs.

View this complete Infra Views post...

Benchmarking Air Emissions

Monday, July 20th, 2015
TABLE 1 100 Largest Electric Power Producers in the U.S. (in order of 2013 electric generation)

CERES
This report examines and compares the stack air pollutant emissions of the 100 largest power producers in the United States based on their 2013 generation, plant ownership, and emissions data. Table 1 lists the 100 largest power producers featured in this report ranked by their total electricity generation from fossil fuel, nuclear, and renewable energy facilities. These producers include public and private entities1 (collectively referred to as “companies” or “producers” in this report) that own roughly 2,800 power plants and account for 85 percent of reported electric generation and 87 percent of the industry’s reported emissions.

View this complete Infra Views post...

Northeast & Mid-Atlantic: Economic Impacts of a Greenhouse Gas Initiative

Friday, July 17th, 2015
Figure ES-1 Actual CO2 Emissions in the RGGI States, Relative to the Emissions Caps in Different Periods

ANALYSIS GROUP
This Report analyzes the economic impacts of RGGI’s most recent three years, covering the years 2012 through 2014. This analysis follows on our prior November 2011 Report (hereafter “AG 2011 Report”) that assessed the economic impacts of RGGI’s first three years (2009-2011). Since the time of our last economic review, the electric industry has experienced changes in power plant economics, emission-control requirements, and wholesale market structures in the RGGI region. In addition, the RGGI states completed a comprehensive program review during 2012, and modified elements of the program including, most importantly, adopting a significantly lower overall cap on CO2 emissions in the RGGI region.

View this complete Infra Views post...

2015 State of the Cities Report

Thursday, July 16th, 2015
Table 3: Key research findings

NATIONAL LEAGUE OF CITIES
Mayors are the leaders who shoulder many of our nation’s most critical problems and from whom solutions can arise. NLC stands ready to support city leaders in their efforts to help mend the nation, and through this annual analysis of mayoral priorities, spotlight challenges, opportunities, and progress in our cities. Whether through their roles in economic development, public safety or education, this year’s report highlights ways local governments are providing the leadership needed to create more equitable communities.

View this complete Infra Views post...

Identifying Transit Deserts in Texas Cities

Wednesday, July 15th, 2015
Table 2: Largest Transit Gaps in Texas Cities

CENTER FOR SUSTAINABLE DEVELOPMENT
UNIVERSITY OF TEXAS AT AUSTIN SCHOOL OF ARCHITECTURE
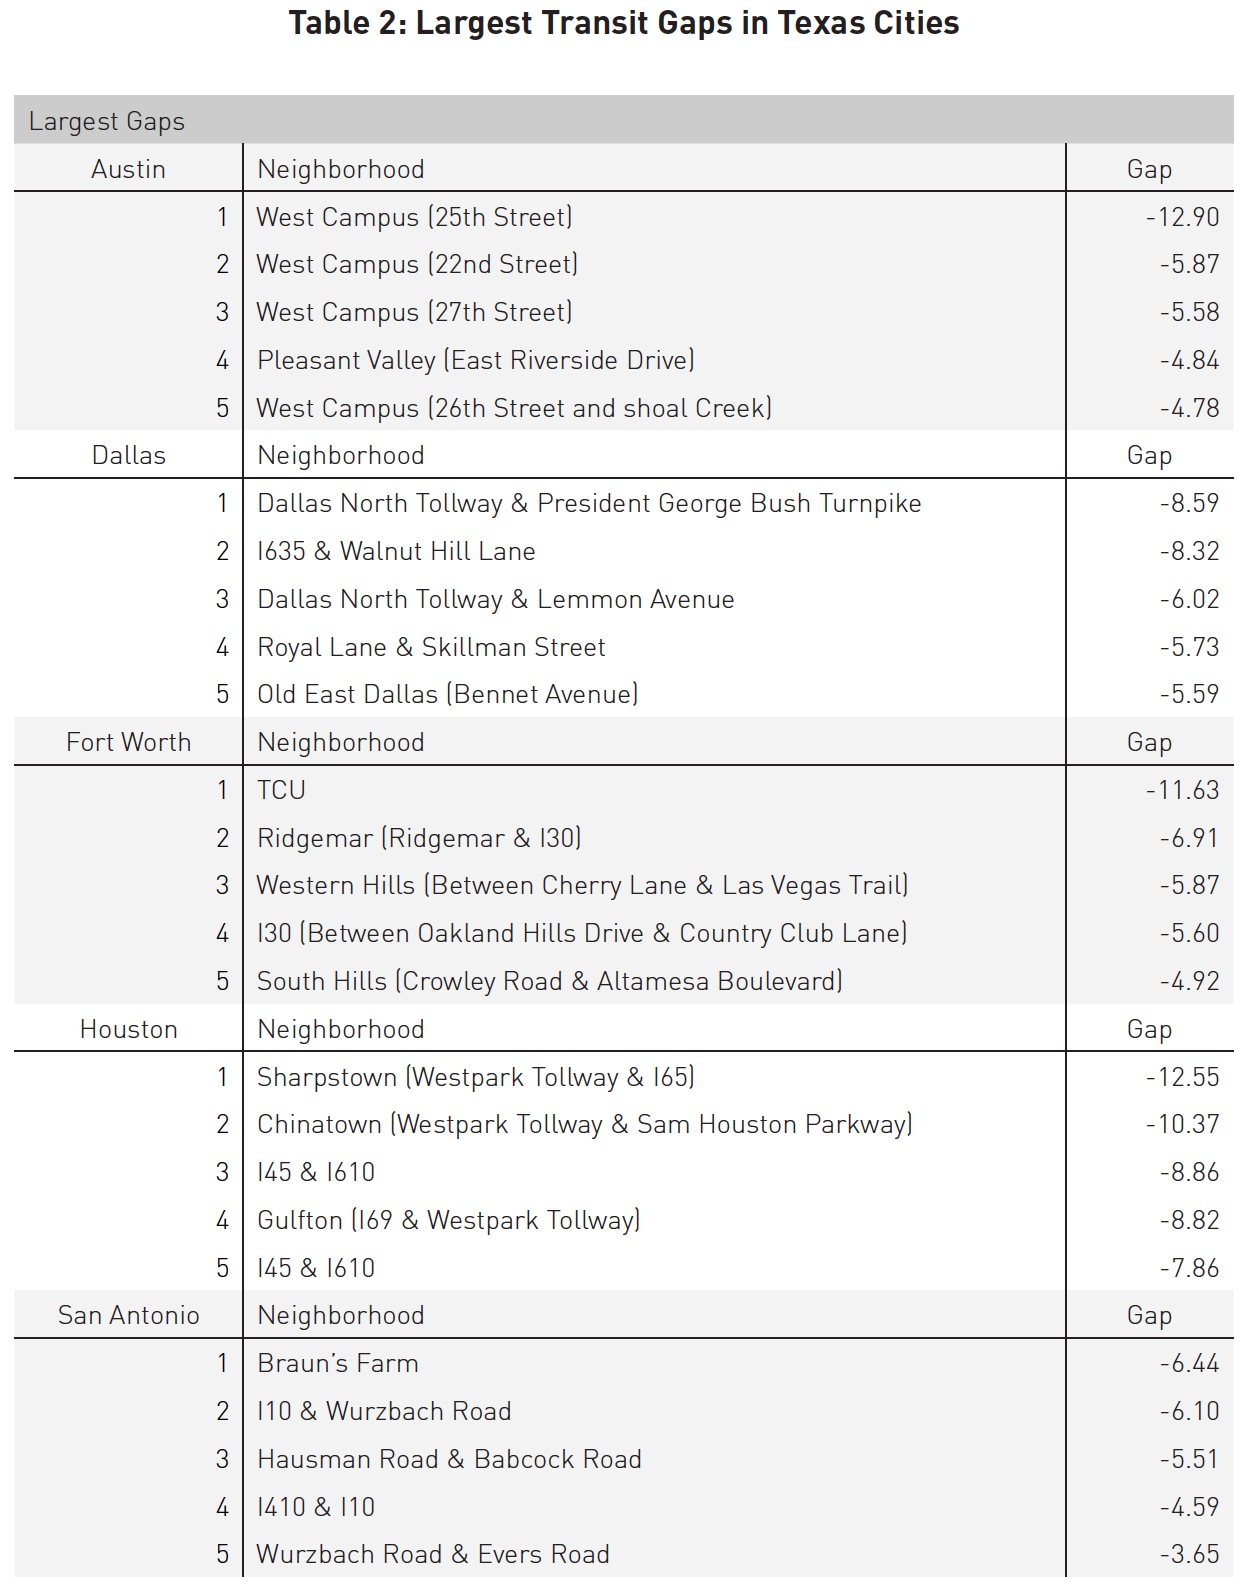
This study builds on previous research that has been done on “transit deserts.” This concept is similar to the popular and thoroughly studied concept of a “food desert,” which is a geographic area where there is no or limited access to fresh food (Clark et al. 2002; Jiao et al. 2012; Whelan et al. 2002; Wrigley 1993; Wrigley et al. 2002). The food desert concept has received a lot of attention and influenced planning policies and practices. By applying the same idea to transit systems within urban areas, geographic areas can be identified where there is a lack of transit service. There are three main steps to this process. This involves identifying the transit dependent populations as a measure of transit demand, calculating the transit supply, and then subtracting the supply from the demand to measure the gap (Jiao & Dillivan 2013).

View this complete Infra Views post...

Follow InfraUSA on Twitter Facebook YouTube Flickr

CATEGORIES


Show us your infra! Show us your infra!

Video, stills and tales. Share images of the Infra in your community that demands attention. Post your ideas about national Infra issues. Go ahead. Show Us Your Infra!  Upload and instantly share your message.

Polls Polls

Is the administration moving fast enough on Infra issues? Are Americans prepared to pay more taxes for repairs? Should job creation be the guiding determination? Vote now!

Views

What do the experts think? This is where the nation's public policy organizations, trade associations and think tanks weigh in with analysis on Infra issues. Tell them what you think.  Ask questions.  Share a different view.

Blog

The Infra Blog offers cutting edge perspective on a broad spectrum of Infra topics. Frequent updates and provocative posts highlight hot button topics -- essential ingredients of a national Infra dialogue.


Dear Friends,


It is encouraging to finally see clear signs of federal action to support a comprehensive US infrastructure investment plan.


Now more than ever, our advocacy is needed to keep stakeholders informed and connected, and to hold politicians to their promises to finally fix our nation’s ailing infrastructure.


We have already engaged nearly 280,000 users, and hoping to add many more as interest continues to grow.


We require your support in order to rise to this occasion, to make the most of this opportunity. Please consider making a tax-deductible donation to InfrastructureUSA.org.


Steve Anderson

Managing Director


SteveAnderson@InfrastructureUSA.org

917-940-7125

InfrastructureUSA: Citizen Dialogue About Civil Infrastructure