


AMERICAN PUBLIC TRANSPORTATION ASSOCIATION
Private providers are anxious to keep the discussion going with public transit agencies, emphasizing that the partnerships are a start toward reducing overall car ridership and encouraging more transit use—while providing them with a possible well of new customers…“There’s been a lot of mutual curiosity,” said Peter Gould, Uber’s senior transportation policy associate. “We’re excited about having these conversations and having these connections, and talking to each other about the other not in a negative sense, but about how we complement public transit and the impact of Uber.”
Infra Views
Connecting the Sectors: Weaving a New Transit Network
Wednesday, February 17th, 2016Philadelphia, PA: The Economic Impact of “Green City, Clean Waters”
Tuesday, February 16th, 2016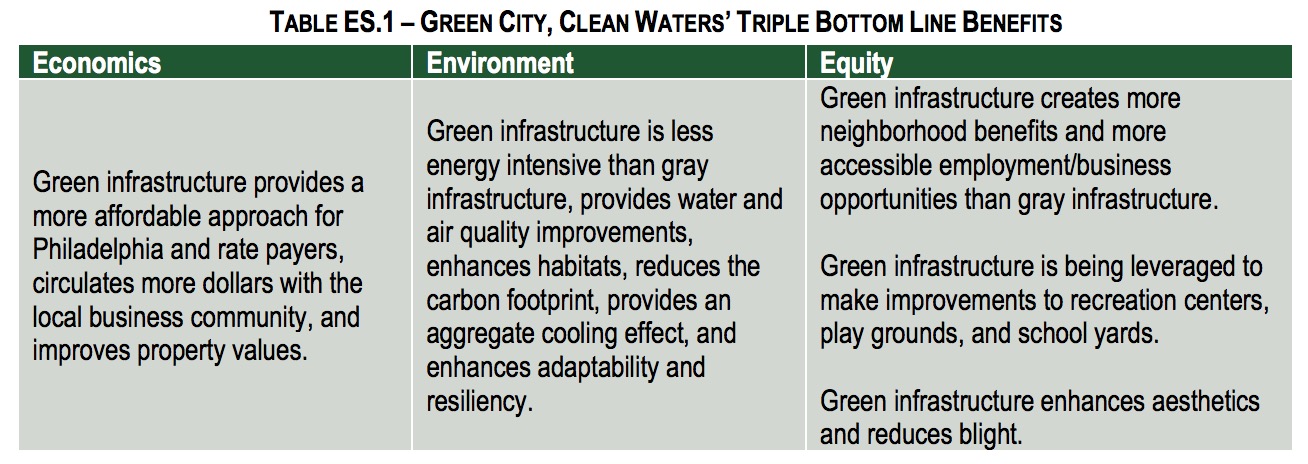
SUSTAINABLE BUSINESS NETWORK
OF GREATER PHILADELPHIA
The purpose of this report is to articulate the local economic impact of Green City, Clean Waters (GCCW), an ambitious initiative of the Philadelphia Water Department that seeks to invest in green stormwater infrastructure (GSI) projects throughout the City of Philadelphia. GCCW fulfills federally established water quality requirements in ways that are simultaneously environmentally sustainable, positive for the local economy, and beneficial to neighborhoods throughout the City (see Table ES.1).
Growing Market Demand for Renewable Power
Monday, February 15th, 2016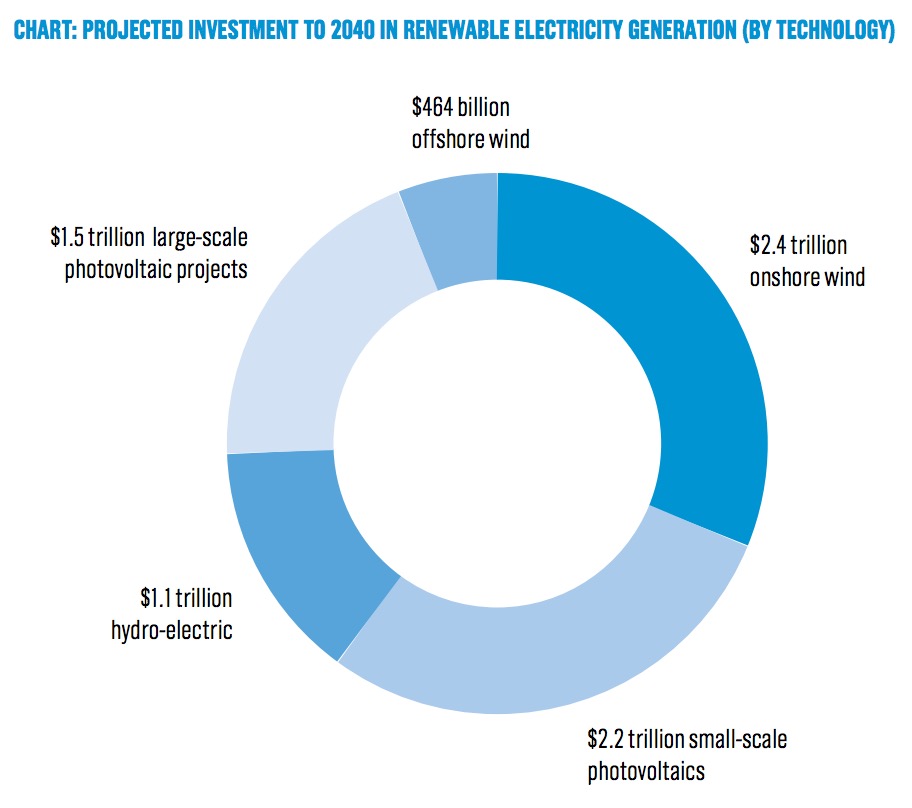
THE CLIMATE GROUP
In 2014, half of all new power capacity was from renewable sources. Renewables now generate 22.8% of all global electricity use – and this is set to grow further still. Looking at economic data, changing policy, power capacity patterns and global demand, we can see that there are multiple reasons for this inevitable shift to renewable sources of power generation.
Atlanta, GA: Economic Benefits of Investing in Transit
Thursday, February 11th, 2016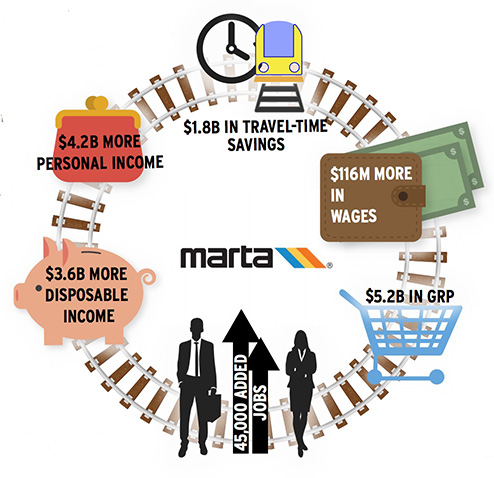
HNTB CORPORATION
In November 2014, HNTB Corporation, in partnership with the Metro Atlanta Chamber, completed and submitted a study of the “Economic Benefits of Investing in Transportation.” The document served as a resource to the Joint Study Committee on Critical Transportation Infrastructure Funding leading to the Georgia State General Assembly enacting HB 170. The Transportation Funding Act of 2015 is estimated to generate just under $1B per year in new transportation funding for road and bridge projects. With Georgia’s road funding needs largely addressed, it is prudent to study other elements of the state’s transportation ecosystem, including public transportation in Metro Atlanta.
ACEC’s ENGINEERING INC. — 2016 Legislative Outlook: Hopeful Signs
Wednesday, February 10th, 2016
AMERICAN COUNCIL OF ENGINEERING COMPANIES (ACEC)
Presidential election cycles represent opportunities for big changes—at least that’s what candidates promise in their stump speeches. In reality, the months leading up to voting day are often characterized by inaction, especially in an era when representatives from both political parties are more focused on waging political battles rather than passing needed legislation.
Corporate Demand for Renewable Energy in Michigan
Monday, February 8th, 2016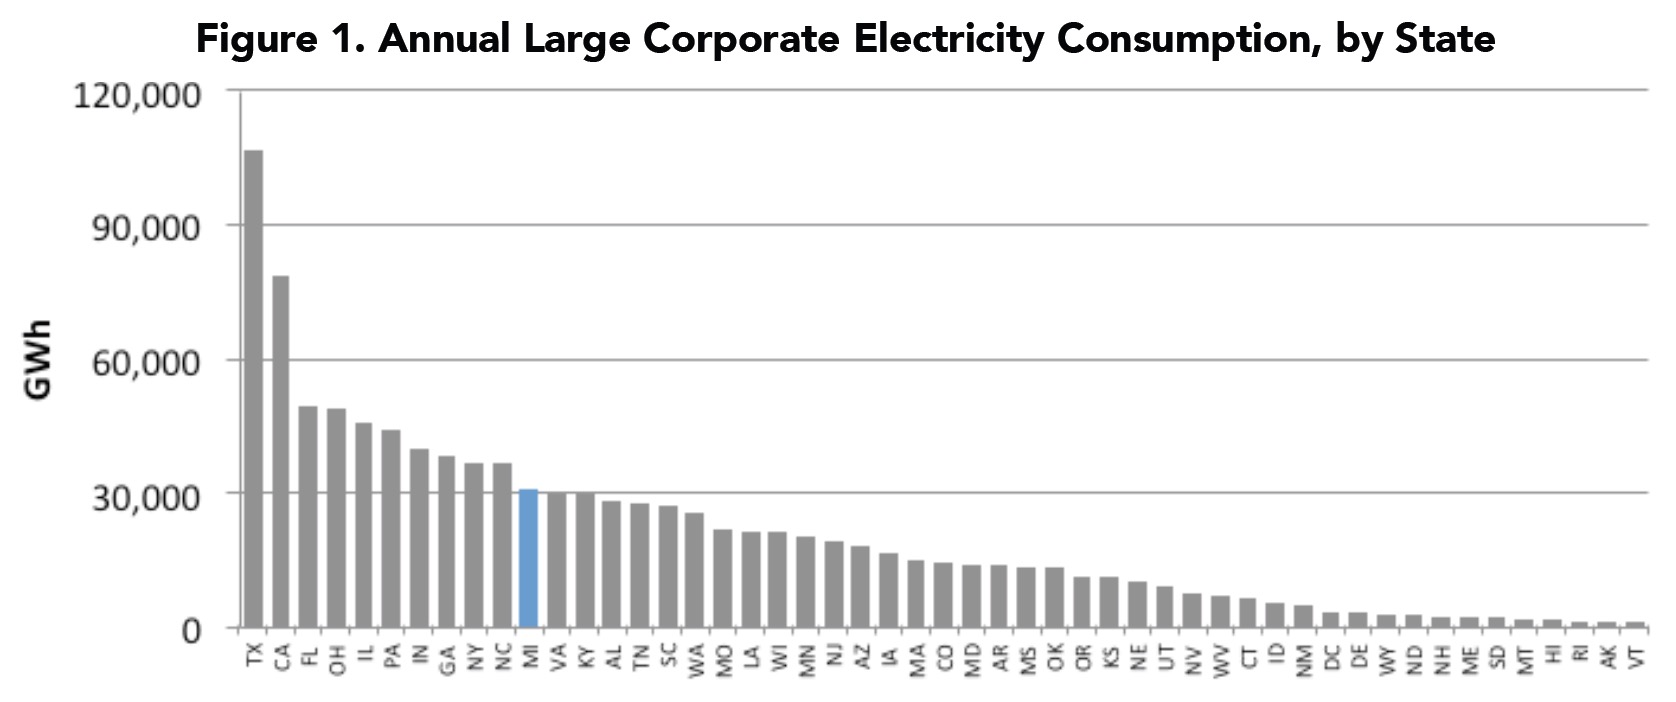
ADVANCED ENERGY ECONOMY (AEE)
Leading corporations nationwide have demonstrated their desire to purchase renewable energy. As of 2014, 43% of Fortune 500 companies and 60% of Fortune 100 companies have set climate and/or clean energy targets,1 and as of December 2015, 49 major corporations, representing a market cap of $15 trillion, have signed on to the Corporate Renewable Energy Buyers’ Principles (see appendix).
Central Texas: Vulnerability of Infrastructure to Extreme Weather
Friday, February 5th, 2016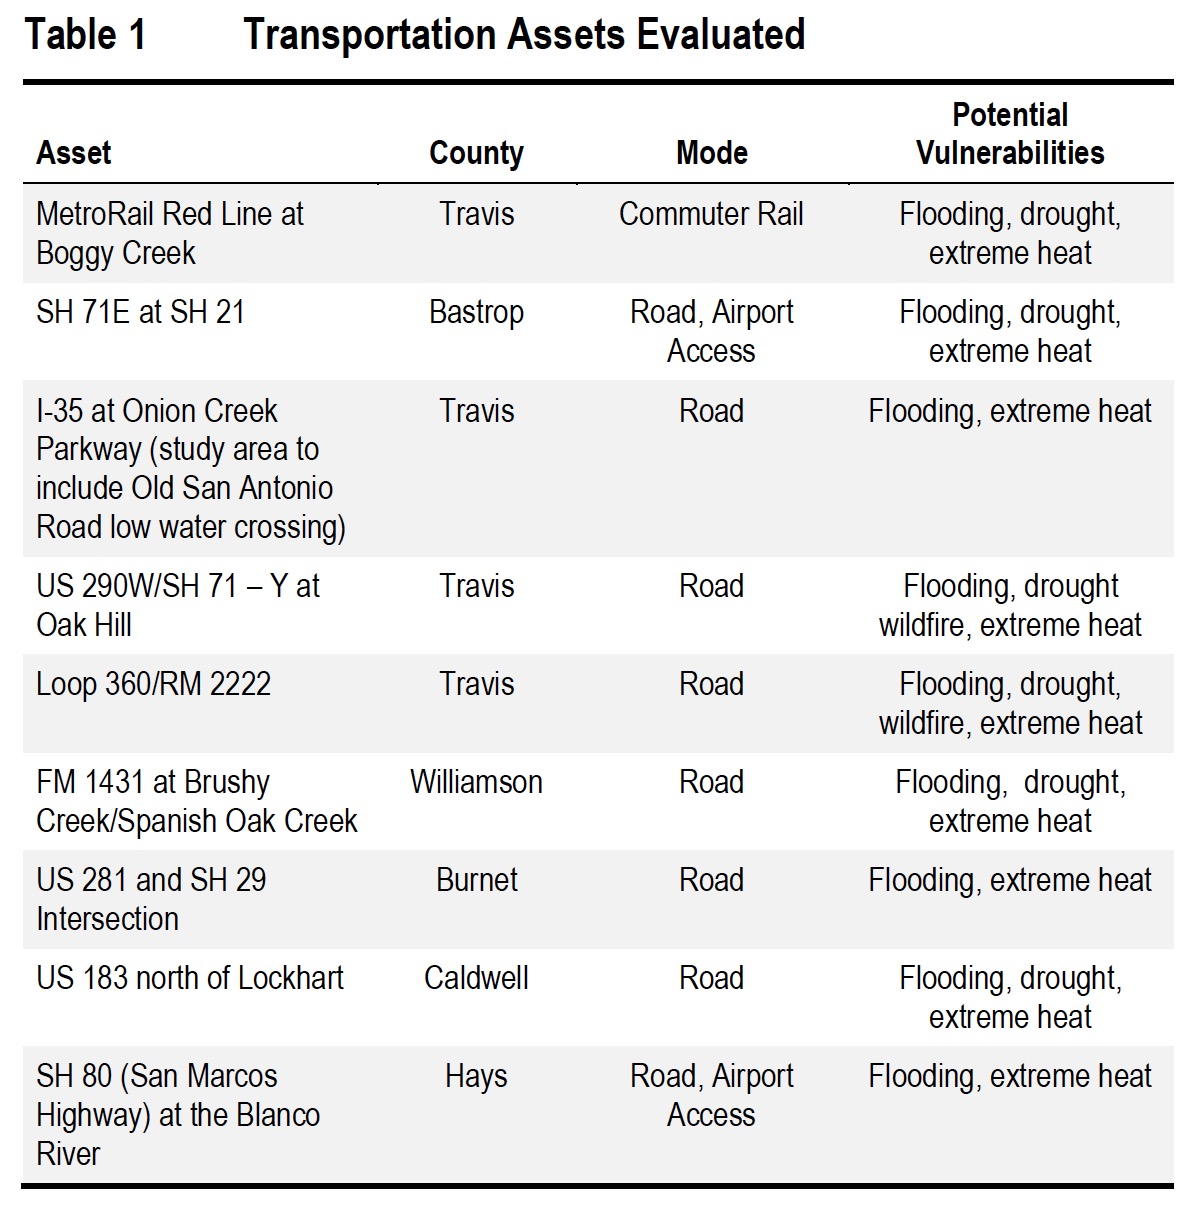
CAPITAL AREA METROPOLITAN PLANNING ORGANIZATION (CAMPO)
The specific purpose of this study was to assess the potential vulnerability of a limited selection of critical transportation assets in the CAMPO region to the effects of extreme weather and climate; to highlight lessons learned in the process, and to outline potential next steps toward enhancing the resilience of the region’s transportation infrastructure. The assets evaluated include roadways, bridges, and rail, and the climate-related stressors considered were flooding, drought, extreme heat, wildfire, and extreme cold (icing). Commensurate with the region’s Long-Range Transportation Plan (LRTP) – under development at the time of writing), the year 2040 was selected as the analysis horizon.
Electric Cars: What Early Adopters And First Followers Want
Thursday, February 4th, 2016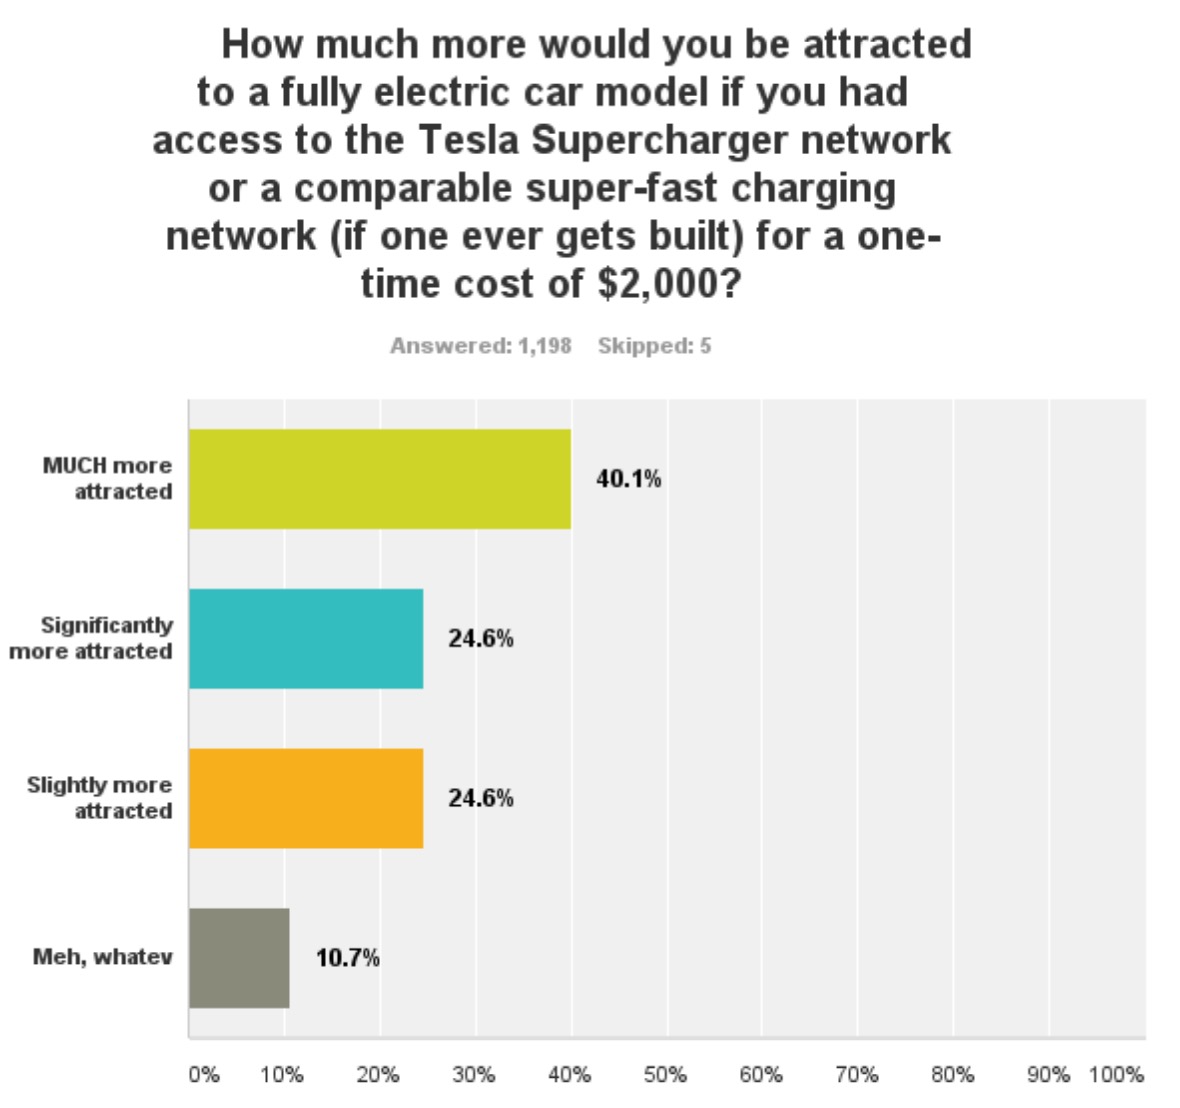
CLEAN TECHNICA
The electric car market has been growing exponentially in the past few years. But it is still a small percentage of the new car market in most places, typically representing less than 1% of new car sales. What is needed to grow electric car sales to a majority of new car sales? What types of cars and what features will dominate in such a market? When will we reach that milestone?
New York State’s Top Transportation Issues
Tuesday, February 2nd, 2016
TRIP Executive Summary Eight years after the nation suffered a significant economic downturn, New York’s economy continues to rebound. The rate of economic growth in New York, which will be greatly impacted by the reliability and condition of the state’s transportation system, continues to have a significant impact on quality of life in the Empire […]
View this complete Infra Views post...The Decline of Driving: Navigating Vermont Without a Car
Monday, February 1st, 2016
VERMONT TRANSPORTATION BOARD
According to the State Smart Transportation Initiative, a transportation research organization based at the University of Wisconsin, vehicle miles traveled per person in the U.S. has dropped every year since. By 2013, the last year for which the Transportation Board could find statistics, the average American drove more than 6 percent fewer miles per year than in 2005…This trend not only holds true in Vermont, but locals appear to be leading the charge. In 2007, Vermonters drove an annual average of 12,400 miles. But in 2013, Vermonters, according to VTrans, drove an average of just 11,356 miles, which is an 8.4 percent drop.
Follow InfrastructureUSA
CATEGORIES
- Accountability (219)
- Aging Infrastructure (747)
- Aviation (130)
- Biking (323)
- Bipartisan (271)
- Bridges (491)
- Broadband (57)
- Buses (160)
- Carbon Tax (22)
- Clean Air (182)
- Climate Change (199)
- Competitiveness (229)
- Congestion (327)
- Dams (77)
- Democrat (123)
- Drinking Water (191)
- Economic Stimulus (275)
- Employment (207)
- Energy (584)
- Environment (615)
- Equity (239)
- Funding (879)
- Global (205)
- Great American Infrastructure (33)
- Green (293)
- Guests on The Infra Blog (263)
- Hazardous Waste (27)
- High Speed Rail (224)
- Highway (783)
- Inland Waterways (204)
- Jobs (251)
- Land Use (97)
- LEED (28)
- Levees (42)
- Local (1,909)
- National (1,523)
- Policy (1,121)
- Pollution (215)
- Private Investment (213)
- Public Opinion (189)
- Public Parks & Recreation (194)
- Public Transportation (1,025)
- Racism (6)
- Rail (501)
- Recession (65)
- Recovery (218)
- Republican (109)
- Roads (1,118)
- Schools (79)
- Seaports (66)
- Smart Grid (98)
- Smart Growth (442)
- Solid Waste (26)
- Sustainability (763)
- Tax (112)
- Technology (395)
- Telecommunications (46)
- Transit (1,330)
- Urban Planning (977)
- Wastewater (180)
- Water Treatment (165)
Show us your infra!
Show us your infra!
Video, stills and tales. Share images of the Infra in your community that demands attention. Post your ideas about national Infra issues. Go ahead. Show Us Your Infra! Upload and instantly share your message.
Polls
Polls
Is the administration moving fast enough on Infra issues? Are Americans prepared to pay more taxes for repairs? Should job creation be the guiding determination? Vote now!
Views
What do the experts think? This is where the nation's public policy organizations, trade associations and think tanks weigh in with analysis on Infra issues. Tell them what you think. Ask questions. Share a different view.
Blog
The Infra Blog offers cutting edge perspective on a broad spectrum of Infra topics. Frequent updates and provocative posts highlight hot button topics -- essential ingredients of a national Infra dialogue.
Dear Friends,
It is encouraging to finally see clear signs of federal action to support a comprehensive US infrastructure investment plan.
Now more than ever, our advocacy is needed to keep stakeholders informed and connected, and to hold politicians to their promises to finally fix our nation’s ailing infrastructure.
We have already engaged nearly 280,000 users, and hoping to add many more as interest continues to grow.
We require your support in order to rise to this occasion, to make the most of this opportunity. Please consider making a tax-deductible donation to InfrastructureUSA.org.
Steve Anderson
Managing Director
SteveAnderson@InfrastructureUSA.org
917-940-7125
Home |
Show Us Your Infra! |
Infra Views |
The Infra Blog |
Infra Polls |
About |
Resources |
Contact |
 RSS Feed
RSS Feed

© InfrastructureUSA | Terms of Use | Site developed by Andigo New Media
InfrastructureUSA.org is a nonprofit project fiscally sponsored by FJC, a Foundation of Philanthropic Funds.