Support for InfrastructureUSA.org
has been provided by these organizations and individuals:

John Hennessy III,
P.E.

Archive for the ‘Sustainability’ Category

#WomenInSTEM: Making a Cleaner Future

Wednesday, September 10th, 2014

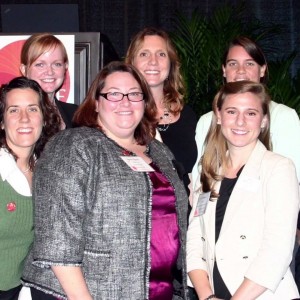
Mallory uses geographic information systems or GIS – a mapping software that she compares to “a real-life videogame” – to assess how various constraints, such as wetlands or an airport, may interact with potential renewable energy projects. Her aim is to site and design projects that can effectively co-exist with the surrounding environment.

View this complete post...

Illinois Highway Materials Sustainability Efforts

Wednesday, September 10th, 2014
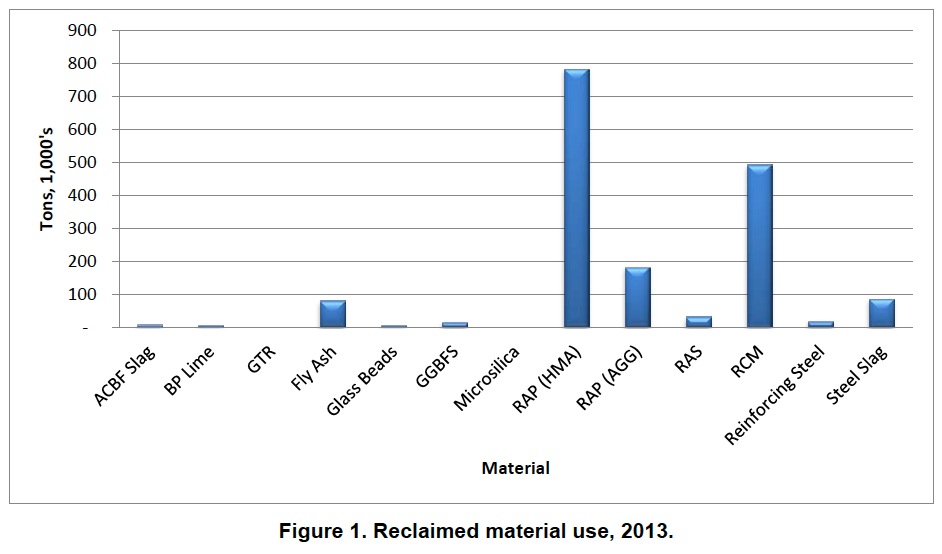
Figure 1. Reclaimed material use, 2013.

ILLINOIS CENTER FOR TRANSPORTATION
The Illinois Department of Transportation (IDOT) has many years of experience using a variety of reclaimed and recycled materials in highway construction. Major material use in highway construction is in the form of aggregates, concrete, and hot-mix asphalt (HMA). It should be no surprise that reclaimed and recycled material use is aligned with usage of these basic construction materials. This report presents the quantity of materials used in 2013, along with specific reporting as required in Illinois Public Act 097-0314. Specific reporting on use of shingles, along with efforts to reduce the carbon footprint and to achieve cost savings through the use of recycled and reclaimed materials, in asphalt paving projects is presented.

View this complete post...

Lansing, MI: Sustainable Construction on Moores River Drive

Tuesday, September 9th, 2014

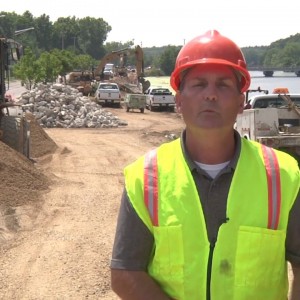
The Moores River Drive Project began in April of 2014. As a part of the project, the existing seawall will be removed and replaced with a sloping embankment along the shoreline. A pathway will also be installed along the embankment. Moores River Drive east of Waverly Road will be reconstructed from a four-lane boulevard to a two-lane road. Mt. Hope will be converted from a four-lane road to a three-lane road with bike lanes. The project will be complete in October 2014.

View this complete post...

Performance of Alternatively Fueled Buses

Friday, September 5th, 2014
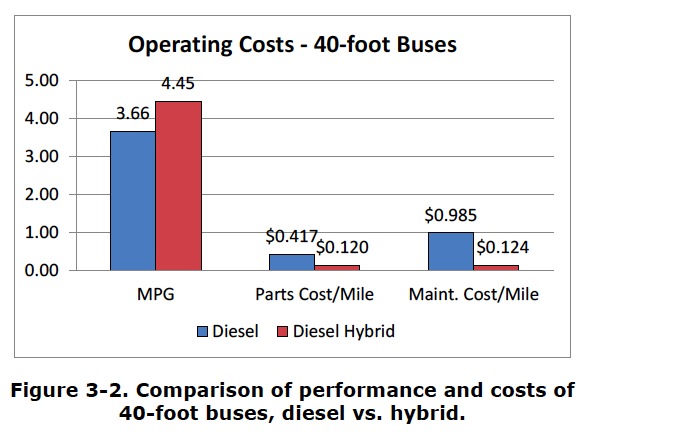
Figure 3-2. Comparison of performance and costs of 40-foot buses, diesel vs. hybrid.

NATIONAL CENTER FOR TRANSIT RESEARCH
Florida transit agencies have been dealing with volatile fuel prices and changes in regulations regarding diesel engines and fuel. In addition, emphasis on reducing the overall consumption of fossil fuels has increased, as well as reducing carbon emissions by transit agencies. Florida transit agencies and funding entities continue to be under pressure to reduce operating costs and to run a more sustainable and environmentally friendly fleet in the urban environment. A popular strategy to pursue these goals has been the acquisition of alternatively fueled buses. However, higher reliance on alternative fuels has increased both capital and operating costs for some fixed route operators, and has created challenges for the widespread adoption of advanced transit technologies.

View this complete post...

Los Angeles: Eastside Transit Corridor Environmental Impact Study

Thursday, September 4th, 2014
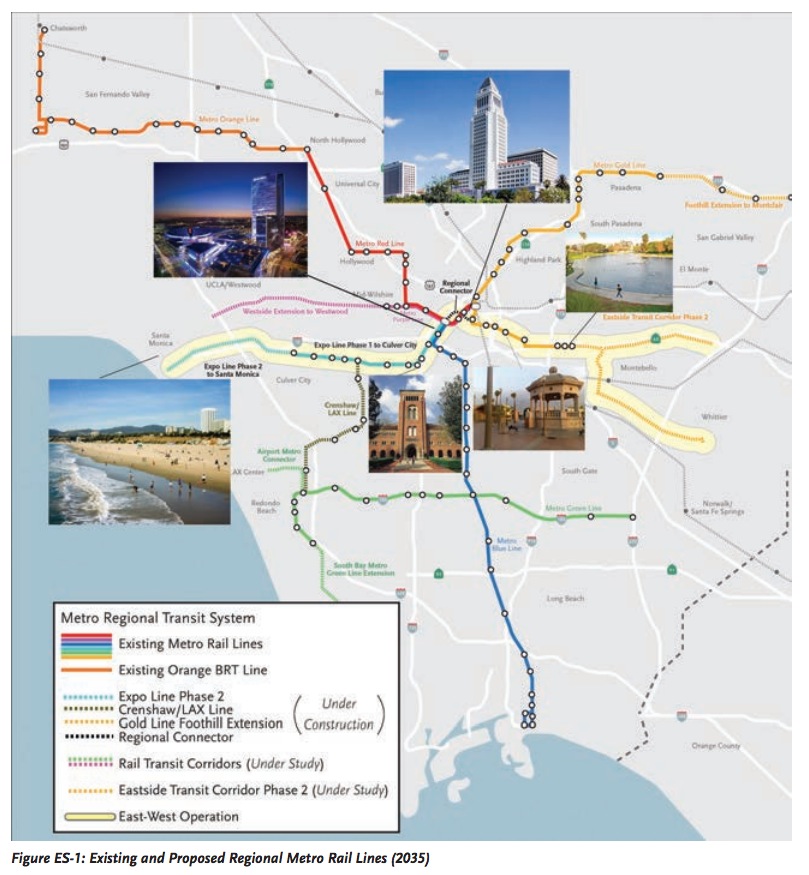
Figure ES-1: Existing and Proposed Regional Metro Rail Lines (2035)

LOS ANGELES COUNTY METROPOLITAN TRANSPORTATION AUTHORITY
In addition to mobility benefits, the Eastside Transit Corridor Phase 2 Project would provide the project area with transportation, economic, land use, and environmental benefits. The analysis presented in this document shows that improved mobility to and from the project area has the potential to boost economic development in the project area and improve social justice by providing better access to employment, educational opportunities, and activity centers. Improved transit connectivity would increase transit ridership, which would also generate environmental benefits through reduced vehicle trips, less roadway congestion, and improved air quality.

View this complete post...

Distributed Wind Energy Market Report

Tuesday, September 2nd, 2014
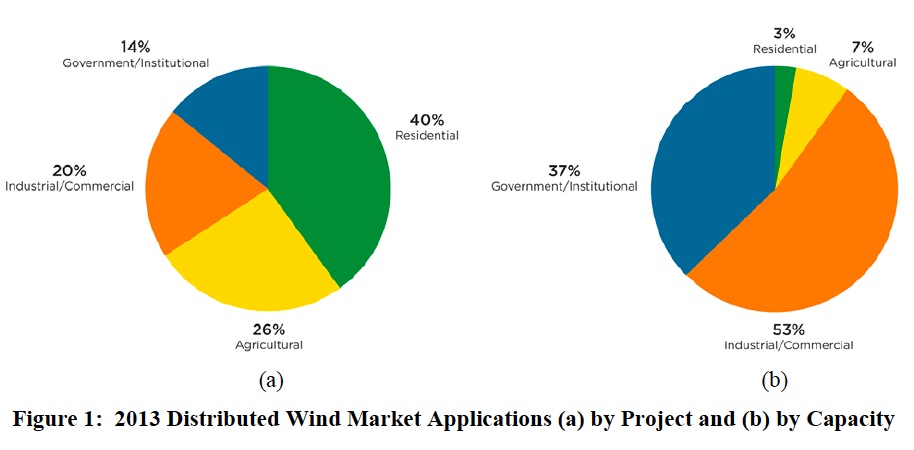
Figure 1: 2013 Distributed Wind Market Applications (a) by Project and (b) by Capacity

UNITED STATES DEPARTMENT OF ENERGY
The purpose of this report is to quantify and summarize the 2013 U.S. distributed wind market to help plan and guide future investments and decisions by industry, utilities, state and federal agencies, and other interested parties. Distributed wind is defined in terms of technology application based on a wind project’s location relative to end-use and power-distribution infrastructure, rather than on turbine or project size. While the distributed wind market includes wind turbines and projects of many sizes, this report breaks the market into two segments when appropriate: wind turbines up through 100 kW (in nominal capacity) referred to in this report as “small wind,” and wind turbines greater than 100 kW used in distributed applications.

View this complete post...

CLEAN ENERGY WORKS FOR US: 2nd Quarter 2014 Report

Monday, September 1st, 2014
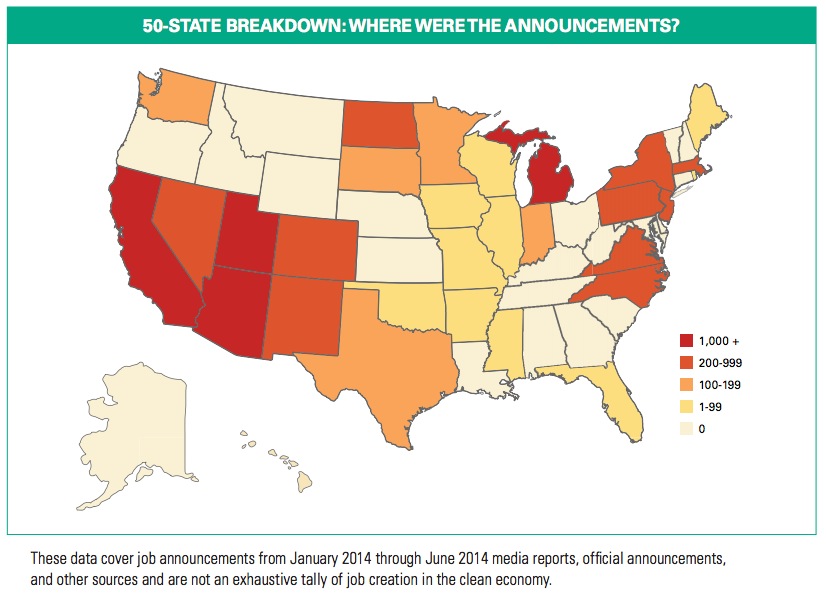
50-STATE BREAKDOWN: WHERE WERE THE ANNOUNCEMENTS?

ENVIRONMENTAL ENTREPRENEURS
More than 12,500 clean energy and clean transportation jobs and clean transportation were announced in 29 states in the second quarter of 2014. This is more than twice the number of jobs announced in the first quarter of the year. Solar generation once again led all sectors — with more than 5,300 jobs announced — as declining module prices and growing private-sector investment expanded job opportunities in the industry. Meanwhile, the wind industry announced about 2,700 jobs, mostly because projects that qualified for the recently expired Production Tax Credit began construction. Wind manufacturers, including Vestas in Colorado and Gearbox Express in Wisconsin, reported hiring additional manufacturing employees to match turbine demand. The biggest hiring boost to the U.S. clean energy manufacturing sector came from the automotive industry, with General Motors and Tesla announcing 1,900 manufacturing jobs to produce electric vehicles.

View this complete post...

Dollars Well Spent: Solar Energy in Massachusetts

Tuesday, August 26th, 2014

Celebrating the summer solstice, the longest day of the year, Undersecretary for Energy Mark Sylvia (then Department of Energy Resources (DOER) Commissioner) and Department of Environmental Protection (DEP) Commissioner David Cash toured six solar investments across the Commonwealth from sun up to sun down. The tour made stops in Chatham, Barnstable, Pembroke, Worcester, Easthampton and Pittsfield, touting the installation of more than 10 megawatts (MW) of solar power on former landfills, and at wastewater treatment plants and drinking water facilities in those communities. The state’s comprehensive solar policies have led to growing deployment of solar power at homes, businesses, schools, parking lots and elsewhere. There is at least one solar installation in 350 of the 351 communities across the Commonwealth, totaling more than 615 MW, which is enough electricity to power nearly 94,000 homes.

View this complete post...
The External Costs of Fossil Fuels; Environmental and Health Value of Solar

Tuesday, August 26th, 2014
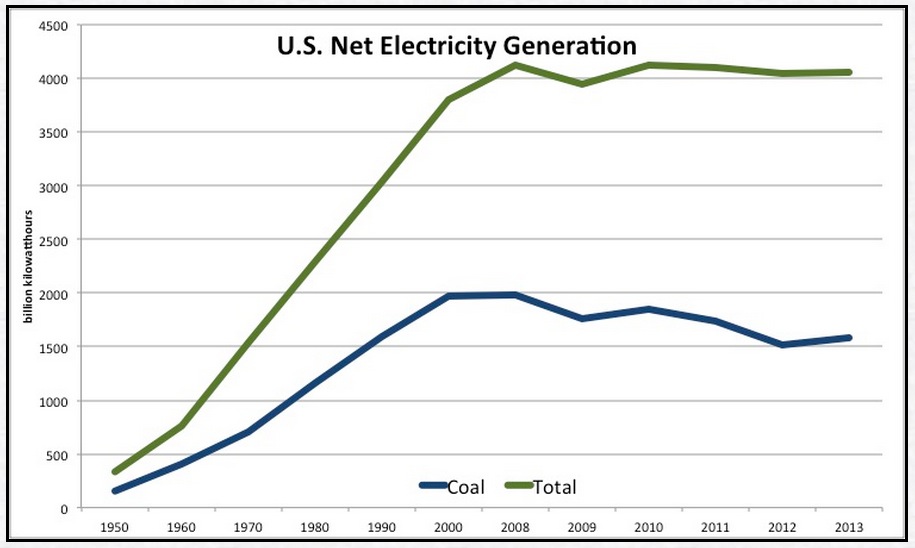
U.S. Net Electricity Generation

ENERGY & POLICY INSTITUTE
Ratepayers and customers have been led to believe that a power plant burning coal or natural gas is the cheapest form of electricity and therefore, should be prioritized over renewable energy generation. However, ratepayers are paying for more than the cost of the fossil fuel that is used to generate electricity. Utility customers pay for the cleanup of toxic spills and health costs associated with burning dirty energy sources. Furthermore, ratepayer’s money spent importing fossil fuels from other states causes unforeseen negative economic impacts when local renewable energy systems could provide economic benefits. Utilities have little economic incentive to reduce fuel costs since the cost of coal and natural gas are passed directly through to customers. Finally, customers ultimately pay for the impacts of climate change, including water scarcity, both of which are fueled and exacerbated by the burning of fossil fuels.

View this complete post...

Los Angeles County: Profile of Clean Energy Investment Potential

Monday, August 25th, 2014
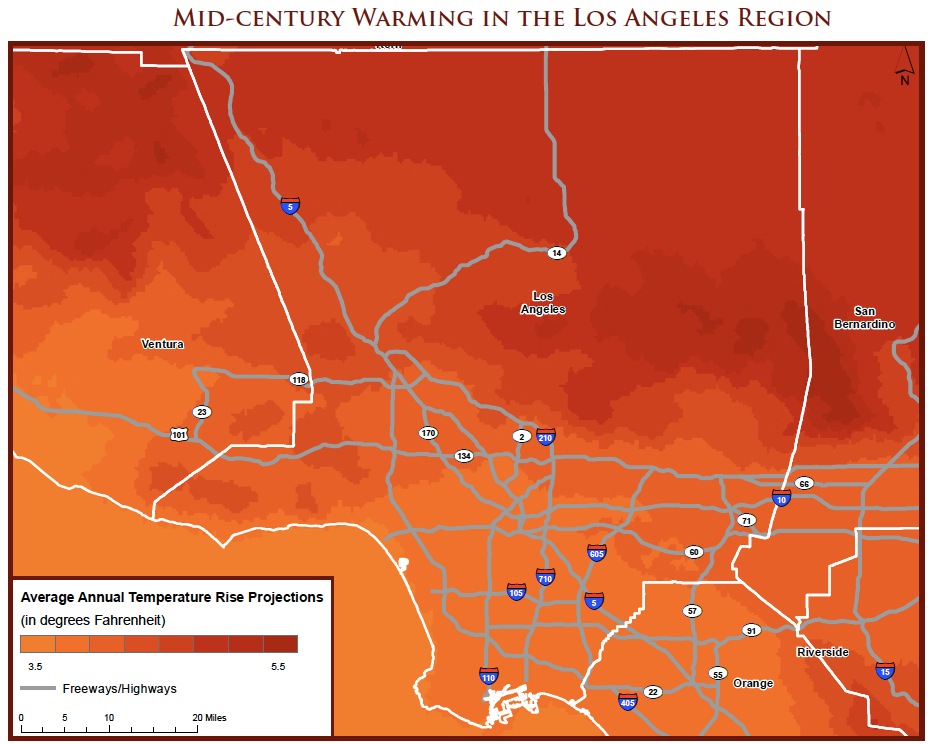
Mid-century Warming in the Los Angeles Region

ENVIRONMENTAL DEFENSE FUND
UCLA LUSKIN CENTER FOR INNOVATION
The Environmental Defense Fund commissioned the UCLA Luskin Center for Innovation to profile the potential for clean energy investments in Los Angeles County. The Los Angeles Solar and Efficiency Report (LASER): An Atlas of Investment Potential is multi-faceted. The LASER Atlas begins with this particular profile of clean energy investment potential at the county level. Other profiles that comprise the LASER Atlas are at the sub-regional level…This county level overview is designed to help community stakeholders identify areas of high potential for solar energy and the benefits of green economic investment. These benefits include capitalizing on incoming state and local funding while creating jobs and building community resilience to current environmental health and energy threats that climate change will exacerbate.

View this complete post...
Follow InfraUSA on Twitter Facebook YouTube Flickr

CATEGORIES


Show us your infra! Show us your infra!

Video, stills and tales. Share images of the Infra in your community that demands attention. Post your ideas about national Infra issues. Go ahead. Show Us Your Infra!  Upload and instantly share your message.

Polls Polls

Is the administration moving fast enough on Infra issues? Are Americans prepared to pay more taxes for repairs? Should job creation be the guiding determination? Vote now!

Views

What do the experts think? This is where the nation's public policy organizations, trade associations and think tanks weigh in with analysis on Infra issues. Tell them what you think.  Ask questions.  Share a different view.

Blog

The Infra Blog offers cutting edge perspective on a broad spectrum of Infra topics. Frequent updates and provocative posts highlight hot button topics -- essential ingredients of a national Infra dialogue.


Dear Friends,


It is encouraging to finally see clear signs of federal action to support a comprehensive US infrastructure investment plan.


Now more than ever, our advocacy is needed to keep stakeholders informed and connected, and to hold politicians to their promises to finally fix our nation’s ailing infrastructure.


We have already engaged nearly 280,000 users, and hoping to add many more as interest continues to grow.


We require your support in order to rise to this occasion, to make the most of this opportunity. Please consider making a tax-deductible donation to InfrastructureUSA.org.


Steve Anderson

Managing Director


SteveAnderson@InfrastructureUSA.org

917-940-7125

InfrastructureUSA: Citizen Dialogue About Civil Infrastructure