PROCEEDINGS OF THE NATIONAL ACADEMY OF SCIENCES OF THE UNITED STATES OF AMERICA (PNAS)
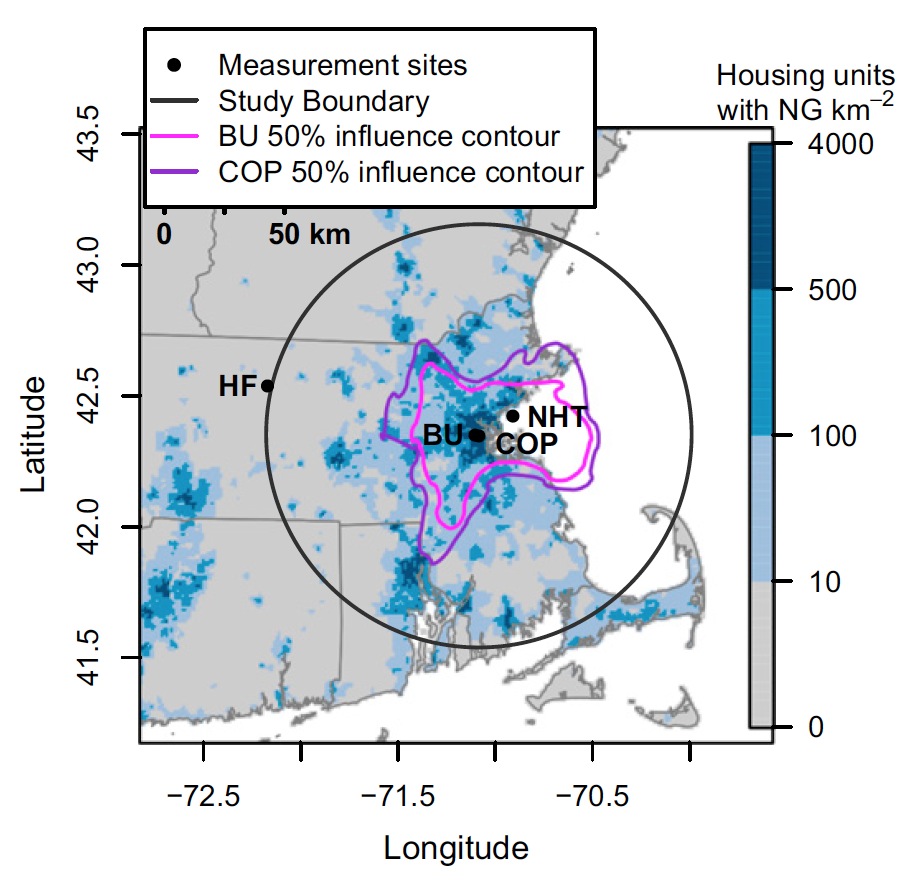
Most recent analyses of the environmental impact of natural gas have focused on production, with very sparse information on emissions from distribution and end use. This study quantifies the full seasonal cycle of methane emissions and the fractional contribution of natural gas for the urbanized region centered on Boston. Emissions from natural gas are found to be two to three times larger than predicted by existing inventory methodologies and industry reports. Our findings suggest that natural-gas–consuming regions may be larger sources of methane to the atmosphere than is currently estimated and represent areas of significant resource loss.

Archive for the ‘Pollution’ Category
Boston: Methane Emissions from Natural Gas Infrastructure
Thursday, January 29th, 2015Our Energy Tomorrow: The State of American Energy
Friday, January 9th, 2015America now occupies a position of energy leadership that was unthinkable a short time ago. Gone are the days of uncertainty and concern over having the supply of energy we need, when we need it. Today, the United States is the world’s top producer of natural gas, the world’s leading refiner of petroleum products, and very soon could be the leading producer of oil…But this is only part of America’s larger energy story. The United States is in the midst of a new era in domestic energy abundance characterized by rising use of renewable energy and increased oil and natural gas production that is strengthening our economic outlook and enabling America to emerge as a global energy superpower.
View this complete post...Boston, MA: Tidal Flows and Waste Systems
Monday, December 29th, 2014With the separation of Boston’s antiquated Combined Sewage system, the city has paved the way for direct recreation and experience of its greatest asset, Boston harbor. This video proposes a series of elevated and sunken land forms to register the tidal current through the stratified ecologies of the intertidal zone. Within the center of a sloped approach, bowl-like landforms trap the retreating water to create artificial tide pools.
View this complete post...Interactive Map: Where Do Trains Carry Crude Oil?
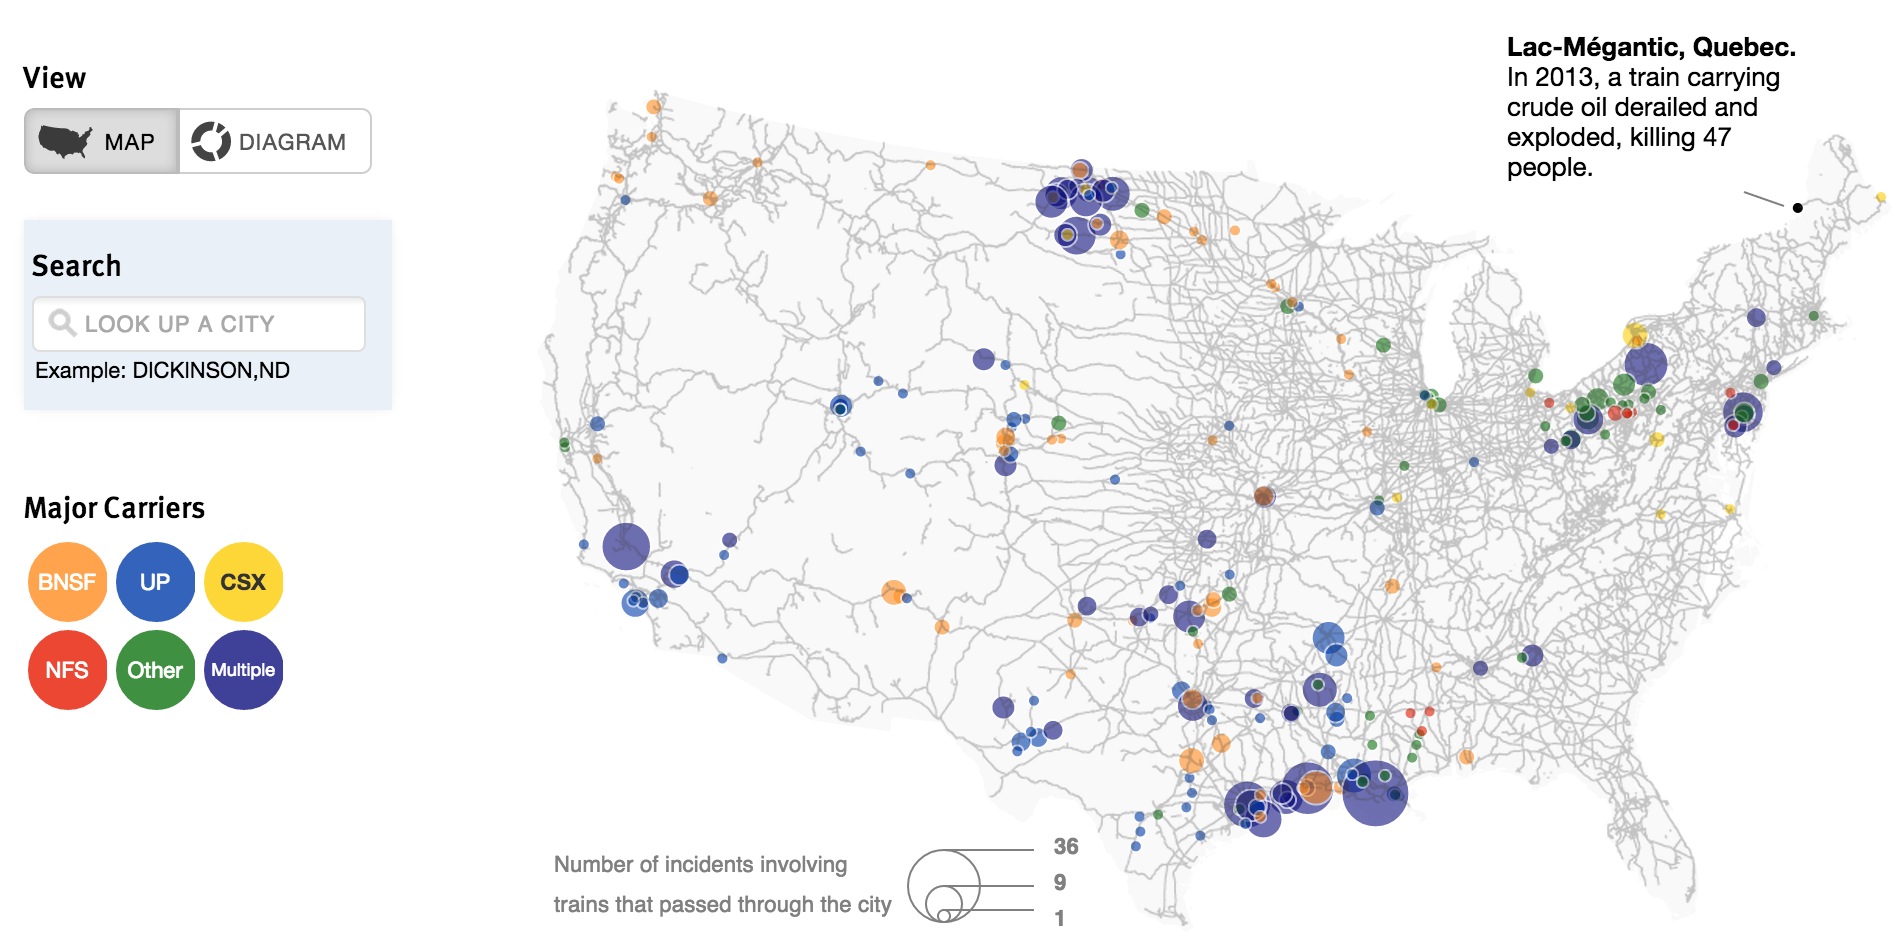
Thursday, December 18th, 2014Rail fans can still spot coal-laden boxcars from coast to coast, but today’s locomotives are increasingly likely to pull tankers full of crude oil. Largely stemming from the fracking boom in North Dakota, crude oil transportation by rail has reached unprecedented heights in past years. In response to a growing number of accidents–some on an apocalyptic scale, as in Lac-Mégantic, Quebec–ProPublica assembled an interactive map to let you know whose tankers carry crude oil, where they’re coming from, and where they’re going.
View this complete post...Provo, UT: Documenting Dangerously High Smog Levels
Friday, December 5th, 2014Through a series of hikes into the mountains, we set out to document through time-lapse, the Haze (CO2 Emissions) that plague our home town of Provo Utah.
A video by Jesse Myrick (USA) – Age Group 18-35
-Connect4Climate on Vimeo
View this complete post...Practicing Risk-Aware Electricity Regulation
Tuesday, December 2nd, 2014Green Highway Snow and Ice Control Cuts the Chemicals
Monday, November 24th, 2014By Rebecca Phillips, University Communications, Washington State University PULLMAN, Wash. – Ice-free pavement. “Smart snowplows.” Vegetable juice ice-melt. Cold-climate researchers at Washington State University are clearing the road with green alternatives to the salt, sand and chemicals typically used for highway snow and ice control. As a nation, “we are kind of salt addicted, like […]
View this complete post...Strengthening the EPA’s Clean Power Plan
Thursday, October 23rd, 2014UNION OF CONCERNED SCIENTISTS
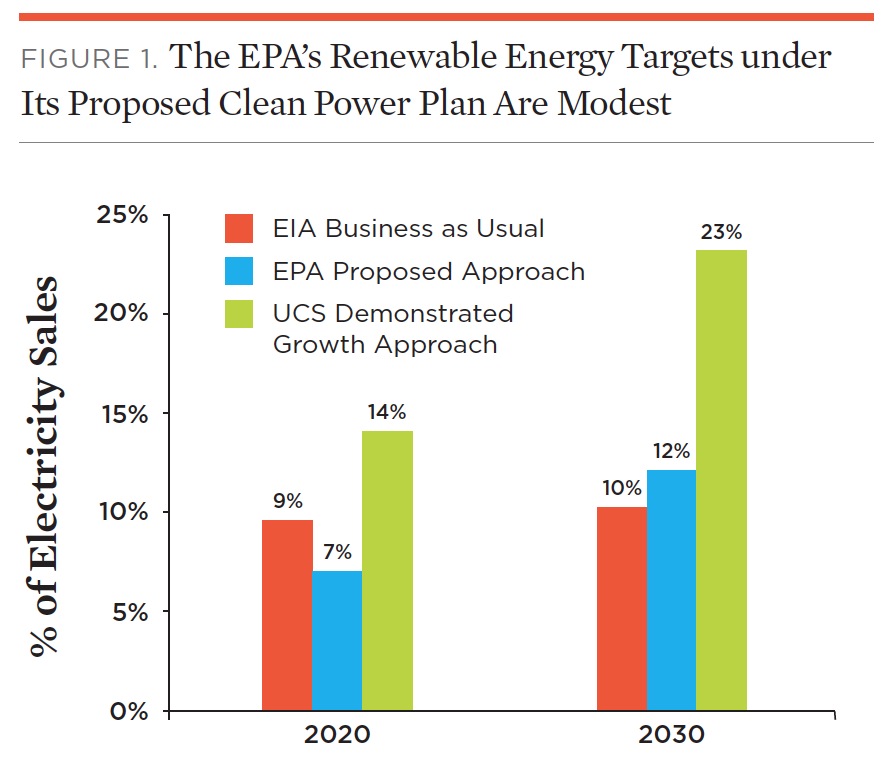
This brief outlines a better way to make the most of renewable energy in the Clean Power Plan, and to strengthen its state renewable energy targets as the cost of sources such as wind and solar power decline. The UCS proposal builds on the EPA’s approach while utilizing the latest available market data, demonstrated rates of growth in renewable energy, and existing state commitments to deploy renewables. Using our recommended modifications, the EPA could nearly double the amount of cost-effective renewable energy in their state targets—from 12 per-cent of total 2030 U.S. electric sales to 23 percent (Figure 1, p. 3).
Automobiles, CO2 and Fuel Efficiency: Trends From 1975 to 2014
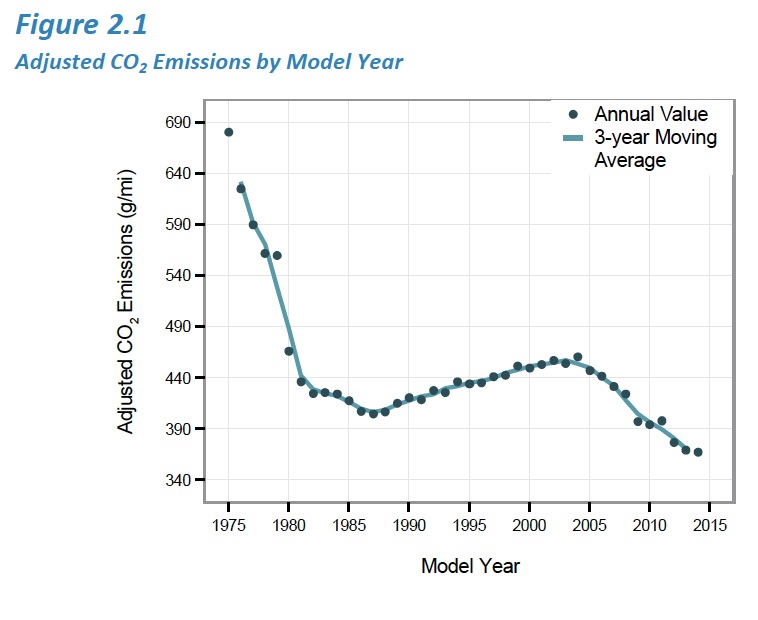
Monday, October 13th, 2014ENVIRONMENTAL PROTECTION AGENCY Overview of Long-Term Trends While the most recent annual changes often receive the most public attention, the greatest value of the Trends database is to document long-term trends. This is because: 1) year-to-year variability can reflect short-term trends (two examples are the Cash for Clunkers rebates in 2009 and the impact of […]
View this complete post...Follow InfrastructureUSA
CATEGORIES
- Accountability (219)
- Aging Infrastructure (755)
- Aviation (130)
- Biking (323)
- Bipartisan (271)
- Bridges (493)
- Broadband (57)
- Buses (160)
- Carbon Tax (22)
- Clean Air (182)
- Climate Change (200)
- Competitiveness (230)
- Congestion (327)
- Dams (77)
- Democrat (123)
- Drinking Water (191)
- Economic Stimulus (276)
- Employment (207)
- Energy (585)
- Environment (615)
- Equity (239)
- Funding (888)
- Global (205)
- Great American Infrastructure (33)
- Green (294)
- Guests on The Infra Blog (281)
- Hazardous Waste (27)
- High Speed Rail (224)
- Highway (785)
- Inland Waterways (204)
- Jobs (251)
- Land Use (98)
- LEED (28)
- Levees (42)
- Local (1,910)
- National (1,526)
- Policy (1,121)
- Pollution (215)
- Private Investment (213)
- Public Opinion (189)
- Public Parks & Recreation (197)
- Public Transportation (1,028)
- Racism (6)
- Rail (503)
- Recession (65)
- Recovery (218)
- Republican (109)
- Roads (1,120)
- Schools (80)
- Seaports (68)
- Smart Grid (98)
- Smart Growth (442)
- Solid Waste (26)
- Sustainability (765)
- Tax (112)
- Technology (397)
- Telecommunications (46)
- Transit (1,333)
- Urban Planning (981)
- Wastewater (181)
- Water Treatment (166)
Video, stills and tales. Share images of the Infra in your community that demands attention. Post your ideas about national Infra issues. Go ahead. Show Us Your Infra! Upload and instantly share your message.
Is the administration moving fast enough on Infra issues? Are Americans prepared to pay more taxes for repairs? Should job creation be the guiding determination? Vote now!
What do the experts think? This is where the nation's public policy organizations, trade associations and think tanks weigh in with analysis on Infra issues. Tell them what you think. Ask questions. Share a different view.
The Infra Blog offers cutting edge perspective on a broad spectrum of Infra topics. Frequent updates and provocative posts highlight hot button topics -- essential ingredients of a national Infra dialogue.
Dear Friends,
It is encouraging to finally see clear signs of federal action to support a comprehensive US infrastructure investment plan.
Now more than ever, our advocacy is needed to keep stakeholders informed and connected, and to hold politicians to their promises to finally fix our nation’s ailing infrastructure.
We have already engaged nearly 280,000 users, and hoping to add many more as interest continues to grow.
We require your support in order to rise to this occasion, to make the most of this opportunity. Please consider making a tax-deductible donation to InfrastructureUSA.org.
Steve Anderson
Managing Director
SteveAnderson@InfrastructureUSA.org
917-940-7125