With the new solar farm on campus, you can look forward to an even brighter future.
View this complete post...


John Hennessy III,
P.E.


With the new solar farm on campus, you can look forward to an even brighter future.
View this complete post...
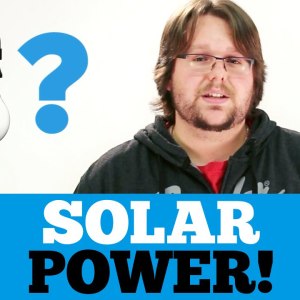
The U.S. Department of Energy has collected data on heat flows in the United States for decades, and has visualized the information in a variety of ways. Their latest interactive map shows where the most geothermal energy potential is located, and where energy companies are already capitalizing on geothermal sources to bolster the grid.
View this complete post...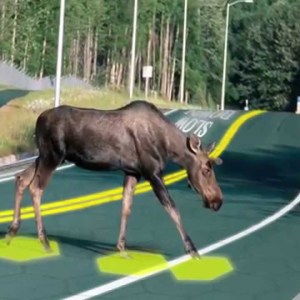
If you have seen this viral video, you will know that Julie and Scott Brusaw have grabbed the imagination of several million people, with an invention that could benefit the lives of hundreds of times that number…When I saw it, several questions occurred to me about things such as cost, practicality, durability, traction and (a bit later) the effect of dirt covering, power generation/distribution, and several more…Here’s a small selection of questions from a large number that have already been answered (and whose answers are kept current as the project evolves)
View this complete post...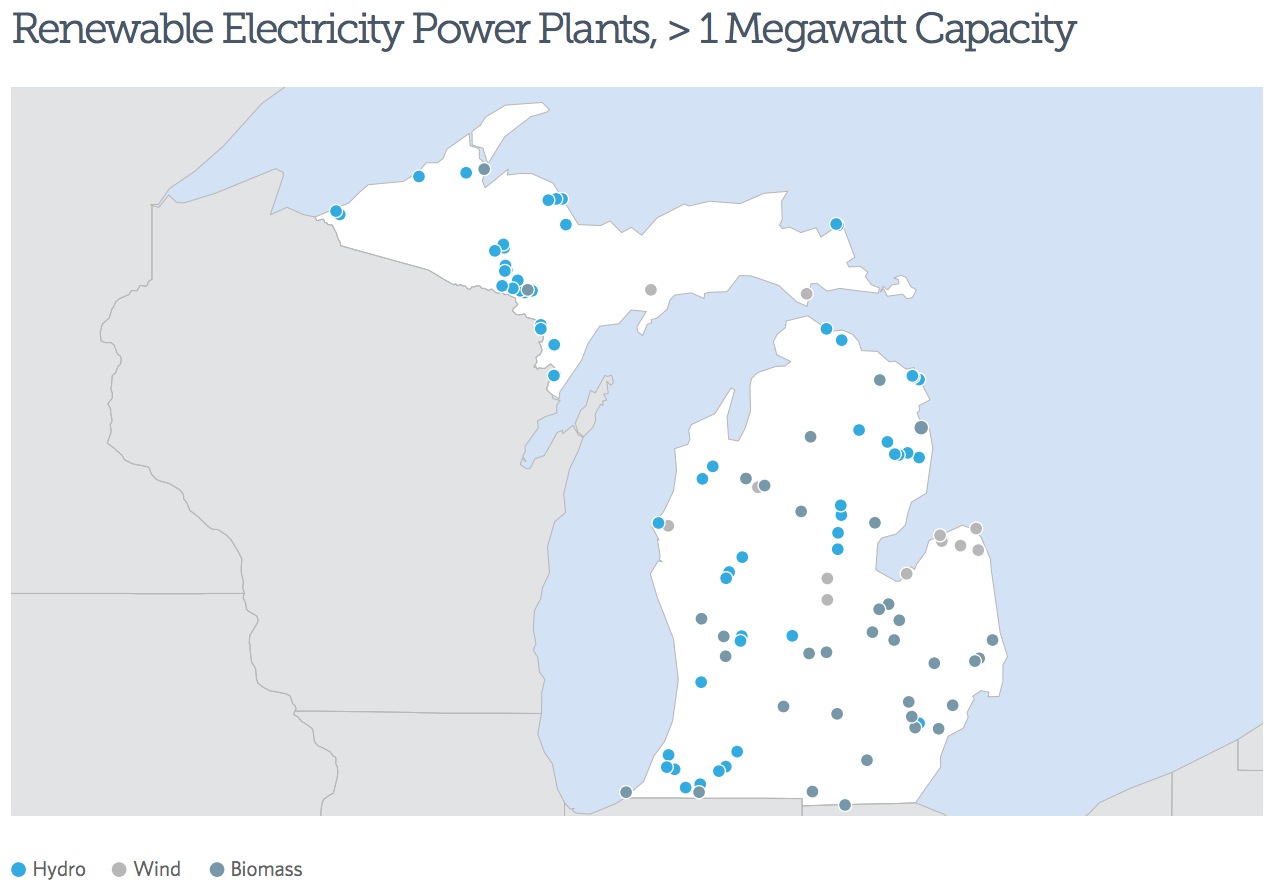
THE PEW CHARITABLE TRUSTS
Michigan’s 2008 Clean, Renewable, and Efficient Energy Act established a renewable portfolio standard, which requires electricity providers to generate 10 percent of their sales from renewable resources by 2015. The standard also allows electric utilities to use energy efficiency and other advanced energy technologies to fulfill part of the requirement.
BLUEGREEN ALLIANCE
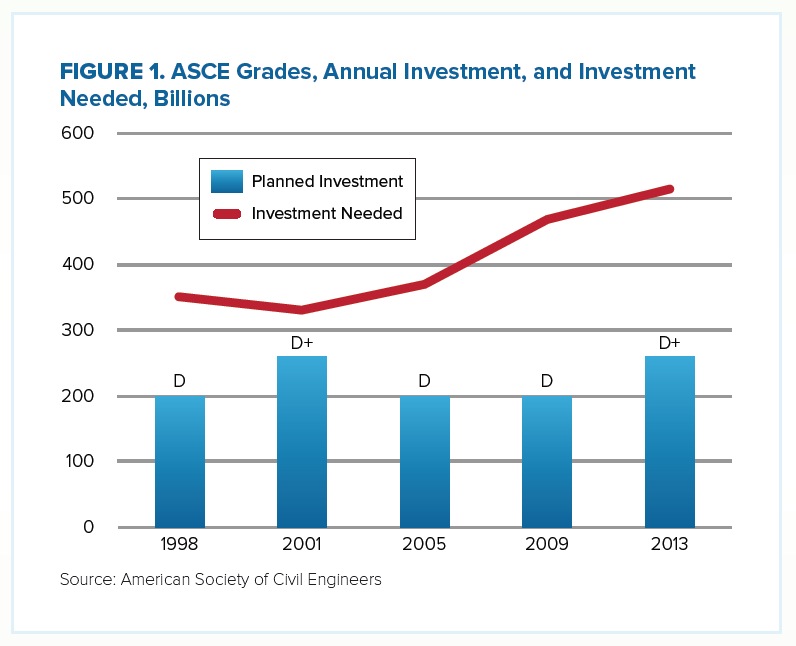
Much of the physical infrastructure of the United States is in a state of disrepair. As documented by the American Society of Civil Engineers (ASCE) in their 2013 Report Card for America’s Infrastructure, our roads, transit systems, dams, and airports need billions of dollars of investment to return them to adequacy. Our water, air, and land are threatened by aging systems designed to provide safe drinking water, handle hazardous waste, treat wastewater, and manage our solid waste. Half of our schools were built to educate the generation that is now retiring, and our electric grid is widely recognized as being incapable of meeting the needs of our changing energy system.
UNION OF CONCERNED SCIENTISTS
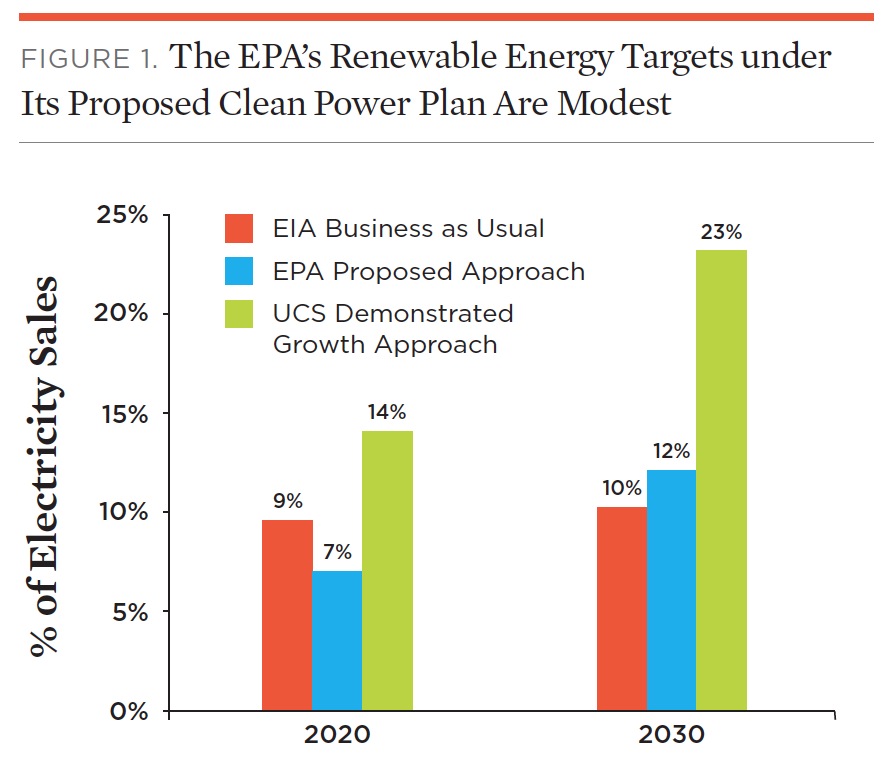
This brief outlines a better way to make the most of renewable energy in the Clean Power Plan, and to strengthen its state renewable energy targets as the cost of sources such as wind and solar power decline. The UCS proposal builds on the EPA’s approach while utilizing the latest available market data, demonstrated rates of growth in renewable energy, and existing state commitments to deploy renewables. Using our recommended modifications, the EPA could nearly double the amount of cost-effective renewable energy in their state targets—from 12 per-cent of total 2030 U.S. electric sales to 23 percent (Figure 1, p. 3).
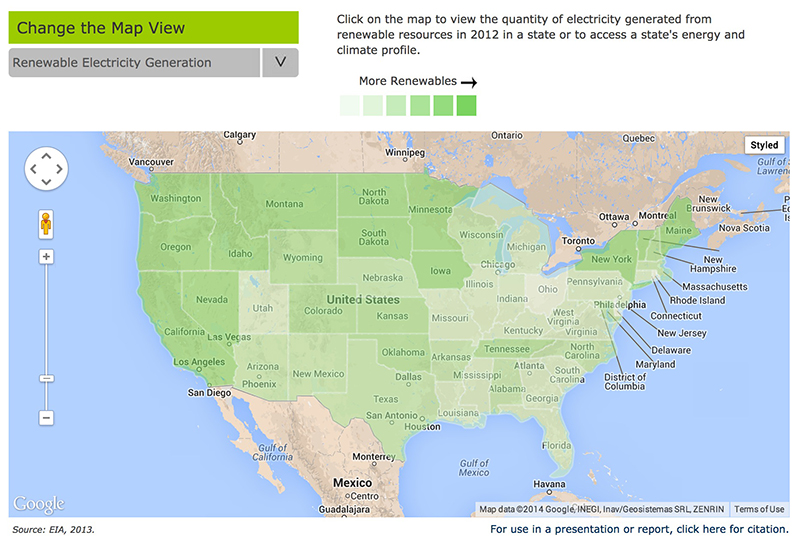
Curious how your state stacks up when it comes to sustainability, renewable energy or climate-friendly policies? The Georgetown Climate Center’s new interactive map includes all these parameters (and much more) in its colorful, easy-to-read interface. With the center’s proprietary State Energy Analysis Tool as the engine, this map offers insight into a wide range of data that’s otherwise hard to come by, from Electricity Market Regulation to Energy Exporters and Importers. State profiles offer an in-depth analysis of each state’s energy/climate breakdown.
View this complete post...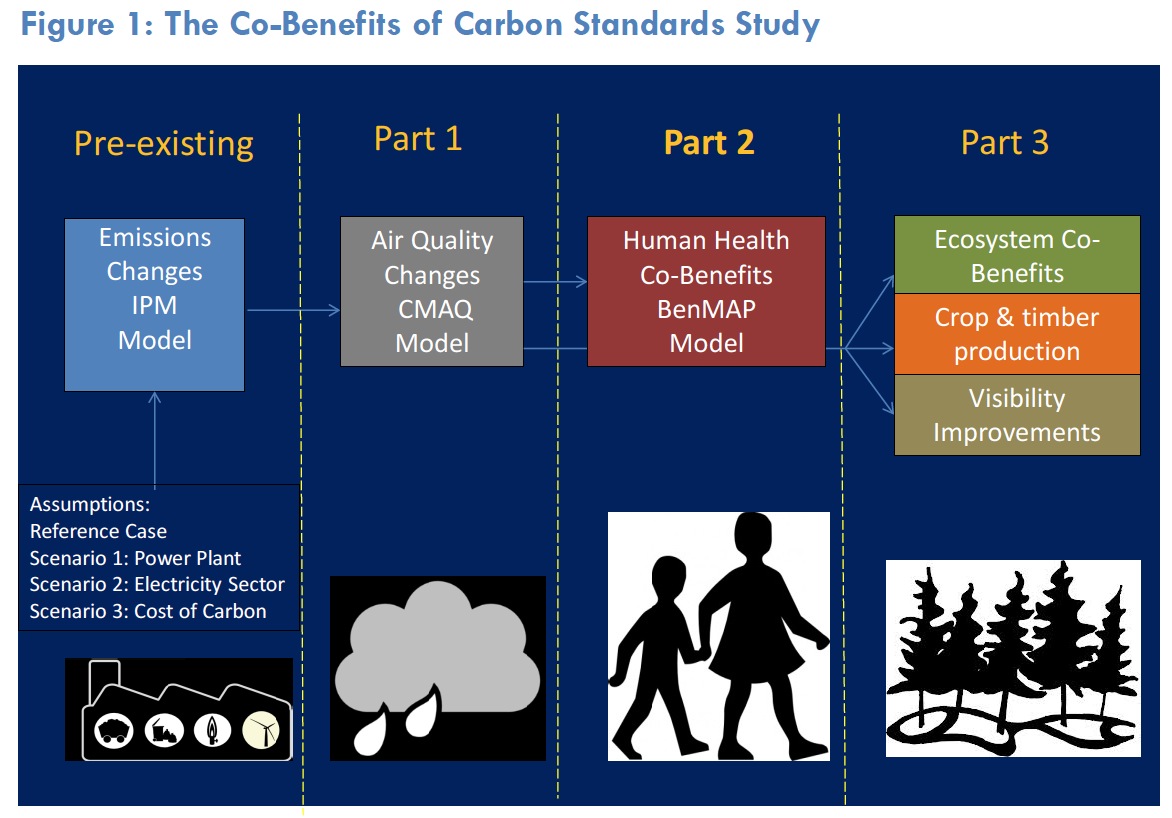
HARVARD SCHOOL OF PUBLIC HEALTH: CENTER FOR HEALTH AND THE GLOBAL ENVIRONMENT
SYRACUSE UNIVERSITY DEPARTMENT OF CIVIL & ENVIRONMENTAL ENGINEERING
BOSTON UNIVERSITY SCHOOL OF PUBLIC HEALTH
The U.S. Environmental Protection Agency (EPA) released the nation’s first-ever carbon pollution standards for existing power plants on June 2, 2014. The EPA-proposed Clean Power Plan would achieve a 30% reduction in carbon emissions from U.S. power plants below 2005 levels by 2030 (USEPA 2014a). Carbon dioxide (CO2) is an important greenhouse gas and a major driver of human-induced global climate change. Fossil-fuel-fired power plants are the single largest source of anthropogenic CO2 emissions in the U.S. They emitted 2.2 billion tons of CO2 in 2012 (AOE 2014) and currently account for 39 percent of total U.S. CO2 emissions (USEPA 2014b).

We’re all aware that America’s infrastructure is in trouble and needs some serious restoration work done ASAP…I don’t need to convince you that we have an urgent problem…Instead, I am here to spark a conversation about a potential solution to two of the problems. In my opinion it’s a pretty sweet deal as it is one solution that fixes two issues. I don’t know about you, but when I’m shopping around I’m a sucker for two for one deals so this tickles my fancy nicely. The problems are our aging roadways and power grid. The solution, potentially, is solar freakin’ roadways.
View this complete post...Follow InfrastructureUSA
Video, stills and tales. Share images of the Infra in your community that demands attention. Post your ideas about national Infra issues. Go ahead. Show Us Your Infra! Upload and instantly share your message.
Is the administration moving fast enough on Infra issues? Are Americans prepared to pay more taxes for repairs? Should job creation be the guiding determination? Vote now!
What do the experts think? This is where the nation's public policy organizations, trade associations and think tanks weigh in with analysis on Infra issues. Tell them what you think. Ask questions. Share a different view.
The Infra Blog offers cutting edge perspective on a broad spectrum of Infra topics. Frequent updates and provocative posts highlight hot button topics -- essential ingredients of a national Infra dialogue.
It is encouraging to finally see clear signs of federal action to support a comprehensive US infrastructure investment plan.
Now more than ever, our advocacy is needed to keep stakeholders informed and connected, and to hold politicians to their promises to finally fix our nation’s ailing infrastructure.
We have already engaged nearly 280,000 users, and hoping to add many more as interest continues to grow.
We require your support in order to rise to this occasion, to make the most of this opportunity. Please consider making a tax-deductible donation to InfrastructureUSA.org.
Steve Anderson
Managing Director
SteveAnderson@InfrastructureUSA.org
917-940-7125
 RSS Feed

© InfrastructureUSA | Terms of Use | Site developed by Andigo New Media
InfrastructureUSA.org is a nonprofit project fiscally sponsored by FJC, a Foundation of Philanthropic Funds.