


CERES
Preface
 The 2019 Benchmarking report is the 15th collaborative effort highlighting environmental performance and progress in the nation’s electric power sector. The Benchmarking series began in 1997 and uses publicly reported data to compare the emissions performance of the 100 largest power producers in the United States. The company rankings are based on 2017 generation and emissions data and aggregate industry trends are presented through 2018.
Data on U.S. power plant generation and air emissions are available to the public through several databases maintained by state and federal agencies. Publicly- and privately-owned electric generating companies are required to report fuel and generation data to the U.S. Energy Information Administration (EIA). Most power producers are also required to report air pollutant emissions data to the U.S. Environmental Protection Agency (EPA). These data are reported and recorded at the boiler, generator, or plant level, and must be combined and presented so that company-level comparisons can be made across the industry.
The Benchmarking report facilitates the comparison of emissions performance by combining generation and fuel consumption data compiled by EIA with emissions data on sulfur dioxide (SO2), nitrogen oxides (NOx), carbon dioxide (CO2) and mercury (Hg) compiled by EPA; error checking the data; and presenting emissions information for the nation’s 100 largest power producers in a graphic format that aids in understanding and evaluating the data. The report is intended for a wide audience, including electric industry executives, environmental advocates, financial analysts, investors, journalists, power plant managers, and public policymakers.
Report Authors: Christopher Van Atten, Amlan Saha, Luke Hellgren, Ted Langlois
Key Findings
- The 100 largest power producers in the United States own roughly 3,000 power plants and account for more than 80 percent of the sector’s electric generation and reported air emissions. Their fuel mix, emissions, and emission rates vary widely as summarized throughout this report (based on 2017 data).
- For the electric sector overall, in 2018, power plant SO2 and NOx emissions were 92 percent and 84 percent lower, respectively, than they were in 1990 when Congress passed major amendments to the Clean Air Act. In 2018, power plant SO2 and NOx emissions were 5.5 percent and 3.7 percent lower than they were in 2017.
- Power sector CO2 emissions increased about 1 percent between 2017 and 2018. This marked a reversal of the annual declines that had occurred each year since 2014. In 2018, power plant CO2 emissions were 4 percent lower than 1990 levels, and 25 percent percent lower than their peak in 2007. Some of the factors driving this longer-term trend include energy efficiency improvements and the displacement of coal by natural gas and renewable energy resources.
- Mercury air emissions from power plants (as reported to the TRI database) have decreased 90 percent since the first-ever federal limits on mercury and other hazardous air pollutants from coal-fired power plants went into effect in 2015.
Electricity in the United States
The electricity sector in the United States includes a wide array of companies that produce and distribute electricity to homes and offices, industrial facilities, and other customers. The services it provides are essential to the growth and functioning of the U.S. economy. In 2018, electricity accounted for almost 40 percent* of primary energy use in the United States, and its share of energy supply is expected to increase in the coming decades with the electrification of transportation and other end-uses.
Benchmarking Analytical Resources
The Benchmarking Report now includes a series of interactive, web-based dashboards to further visualize the emissions and electricity generation from power producers in the United States. These tools provide insight into how facility- and company-level emissions and generation are changing over time by utilizing historical Benchmarking data (2008-2017). Data include:
- Environmental: Company-specific emissions and emission rates by company type and pollutant
- Operational: Electricity generation and relevant data aggregated by company type, company, and other metrics
- Locational: Facility-level emissions and generation visualized by fuel
type, company ownership, and other metrics
Sector 1: U.S. Electric Sector Highlights
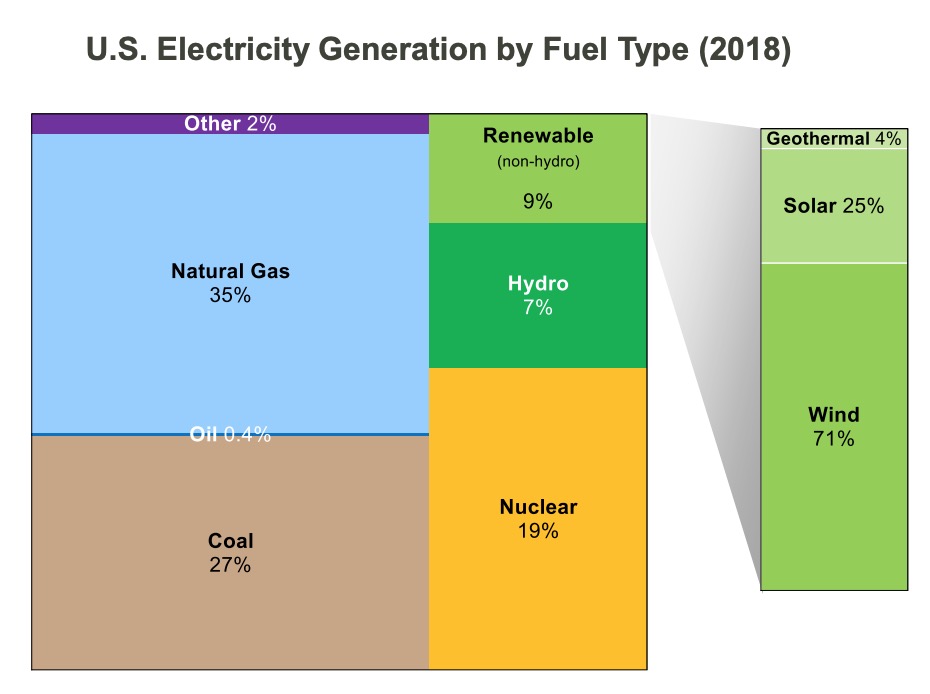
U.S. Generation by Fuel Type
- In 2018, the U.S. electric system continued its general shift away from coal toward lower- and zero-emitting sources. For the second consecutive year, natural gas was the leading source of electricity generation in the U.S. (35 percent), followed by coal (27 percent).
- Nuclear plants accounted for 19 percent, hydroelectric resources 7 percent, and oil-fired resources <1 percent. Non-hydroelectric renewables: wind, solar, and geothermal, accounted for 9 percent of total U.S. generation.
- Other fuel sources such as biomass, municipal solid waste, tire-derived fuel, manufactured and waste gases, etc., accounted for 2 percent.
- This is a significant shift from the generation mix a decade ago. In 2006, coal accounted for 49 percent of power production, while natural gas generated only 20 percent.
Zero-Carbon Generation in the United States
In 2017, renewables and other zero-carbon resources generated more than 35% of U.S. electricity, making it the leading source of power generation for the first time. Natural gas was second (32.1%) and coal was third (29.8%). Of the zero-carbon resources, nuclear made up 56.3%, renewables 22.6%, and hydro 21.1%.
About Ceres
https://www.ceres.org
Ceres is a sustainability nonprofit organization working with the most influential investors and companies to build leadership and drive solutions throughout the economy. Through powerful networks and advocacy, Ceres tackles the world’s biggest sustainability challenges, including climate change, water scarcity and pollution, and inequitable workplaces.
Tags: Ceres, Emissions, MJ Bradley, Pollution
 RSS Feed