CERES
Emissions of the 100 Largest Electric Power Producers
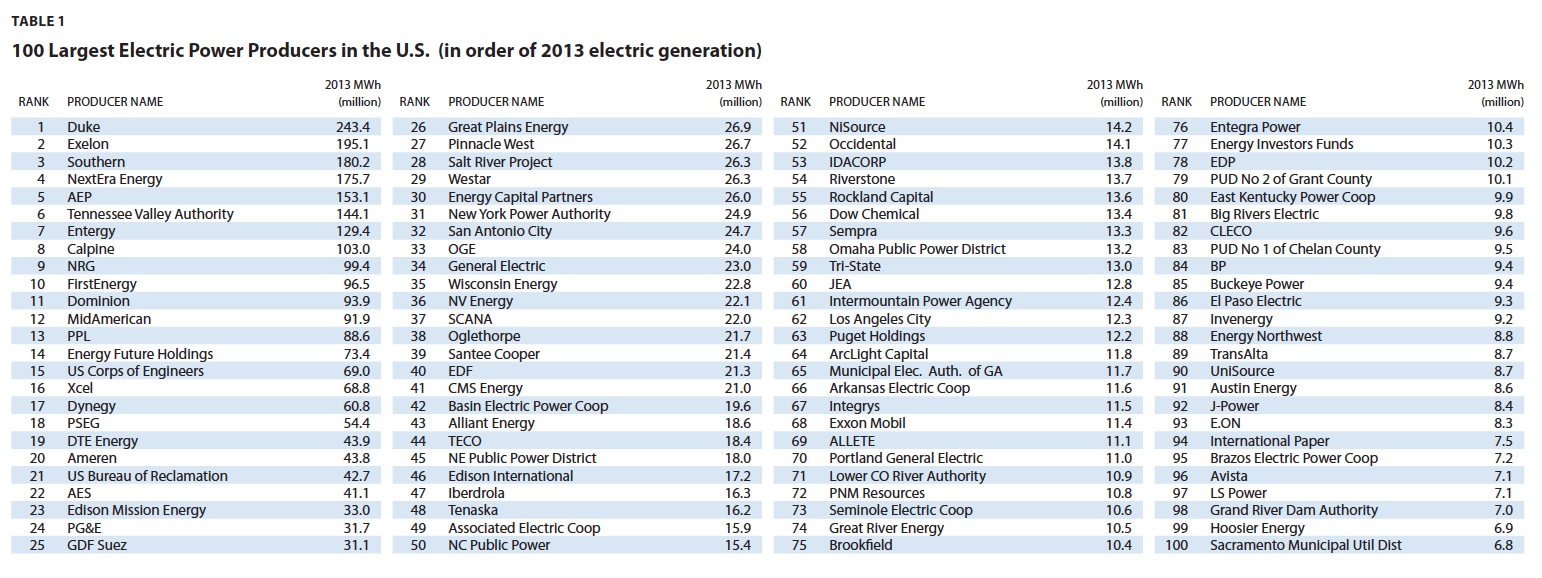
This report examines and compares the stack air pollutant emissions of the 100 largest power producers in the United States based on their 2013 generation, plant ownership, and emissions data. Table 1 lists the 100 largest power producers featured in this report ranked by their total electricity generation from fossil fuel, nuclear, and renewable energy facilities. These producers include public and private entities1 (collectively referred to as “companies” or “producers” in this report) that own roughly 2,800 power plants and account for 85 percent of reported electric generation and 87 percent of the industry’s reported emissions.
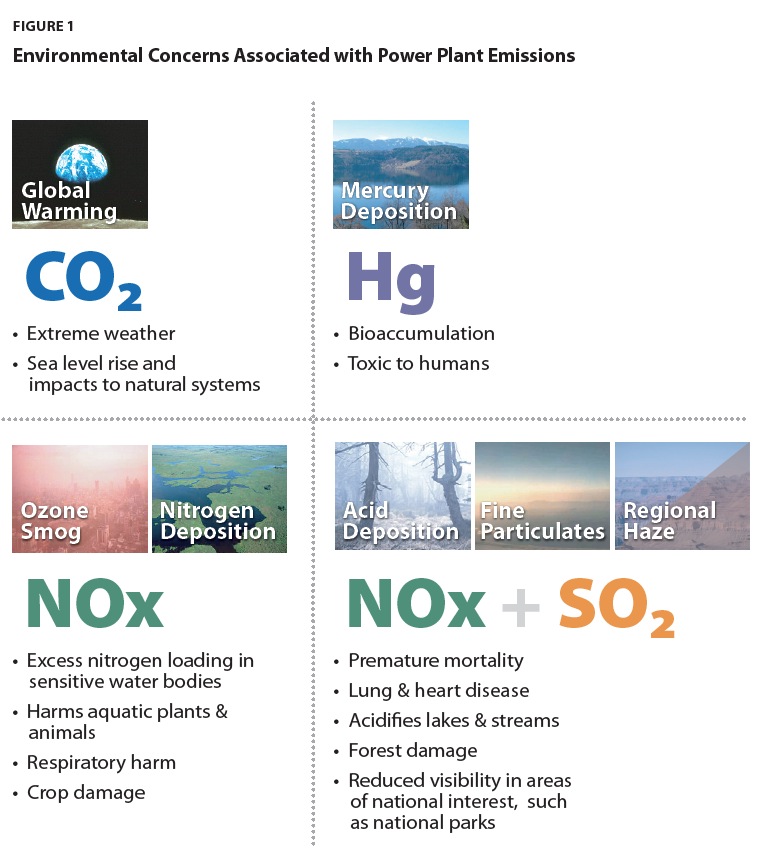
The report focuses on four power plant pollutants for which public emissions data are available: sulfur dioxide (SO2), nitrogen oxides (NOx), mercury (Hg), and carbon dioxide (CO2). These pollutants are associated with significant environmental and public health problems, including acid deposition, global warming, fine particle air pollution, mercury deposition, nitrogen deposition, ozone smog, and regional haze. The report benchmarks, or ranks, each company’s absolute emissions and its emission rate (determined by dividing emissions by electricity produced) for each pollutant against the emissions of the other companies.
 In 2013, the 100 largest power producers in the U.S. generated 87 percent of the industry’s air pollution emissions. The 100 largest power producers emitted in aggregate approximately 2.9 million tons of SO2, 1.46 million tons of NOx, 20.7 tons of mercury, and 1.95 billion tons of CO2. Air pollution emissions from power plants are highly concentrated among a small number of producers. The top ten producers were responsible for 41 percent of the SO2, 36 percent of the NOx, 34 percent of the mercury, and 38 percent of the CO2 emissions of the 100 largest producers.
Electric power producers’ emission levels and emission rates vary significantly due to the amount of power produced, the efficiency of the technology used in producing the power, the fuel used to generate the power, and installed pollution controls. The average and median emission rates (pounds per megawatt hour (lb/MWh)) shown in Table 2 provide benchmark measures of overall industry emissions that can be used as reference points to evaluate the emissions performance of individual power producers.
Across the industry, power plant emissions of SO2 and NOx have decreased and CO2 emissions have increased since 1990. The power industry has dramatically reduced its SO2 and NOx emissions. In 2013, power plant SO2 and NOx emissions were 80 percent and 74 percent lower, respectively, than they were in 1990. In 2013, power plant CO2 emissions were 14 percent higher than they were in 1990. In recent years, from 2008 through 2013, power plant CO2 emissions decreased by 12 percent. Mercury emissions from power plants have decreased 50 percent since 2000 (the first year that mercury emissions were reported by the industry under the Toxics Release Inventory). Collectively, power plants are responsible for a declining share of U.S. air pollution emissions. In 2013, power plants were responsible for about 63 percent of SO2 emissions, 13 percent of NOx emissions, 38 percent of mercury emissions, and 61 percent of CO2 emissions.
Download full version (PDF): Benchmarking Air Emissions
About Ceres
www.ceres.org
Ceres (pronounced “series”) is a national network of investors, environmental organizations and other public interest groups working with companies and investors to address sustainability challenges such as global climate change.
Tags: Ceres, Emissions, power plants


 RSS Feed