ENVIRONMENTAL PROTECTION AGENCY
Overview of Long-Term Trends
While the most recent annual changes often receive the most public attention, the greatest value of the Trends database is to document long-term trends. This is because: 1) year-to-year variability can reflect short-term trends (two examples are the Cash for Clunkers rebates in 2009 and the impact of the tsunami aftermath on Japan-based manufacturers in 2011) that may not be meaningful from a long-term perspective, and 2) the magnitude of year-to-year changes in annual CO2 emissions and fuel economy tend to be small relative to longer, multiyear trends.
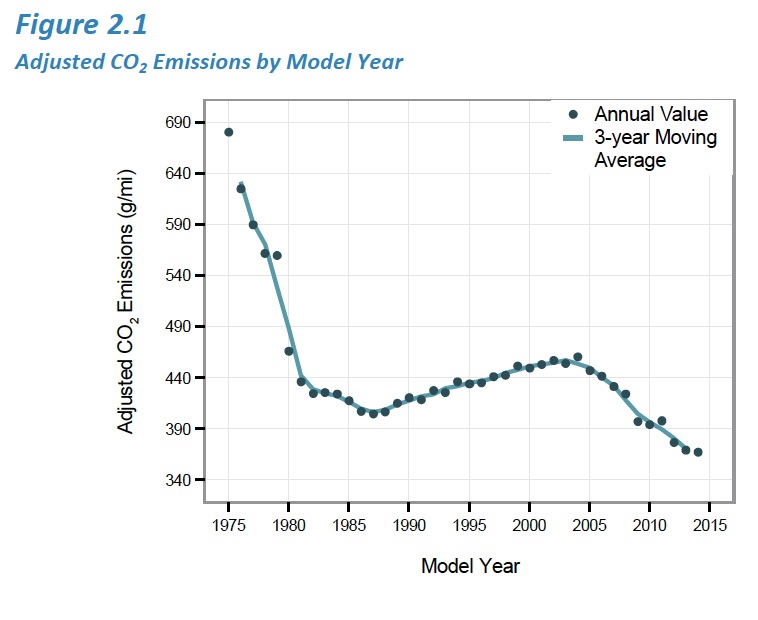
Figures 2.1 and 2.2 show fleetwide adjusted CO2 emissions and fuel economy from Table 2.1 for MY 1975-2014. For both figures, the individual data points represent annual values, and the curves represent 3-year moving averages (where each year represents the average of that model year, the model year prior, and the model year following, e.g., the value for MY 2012 represents the average of MY 2011-2013) which “smooth out” the year-to-year volatility. The two curves are essentially inversely proportional to each other, i.e., vehicle tailpipe CO2 emissions (grams per mile) are proportional to fuel consumption (gallons per mile), which is the reciprocal of fuel economy (miles per gallon).
…
Since 1975, half of car production has consistently been within several mpg of each other. The fuel economy difference between the least efficient and most efficient car increased from about 20 mpg in MY 1975 to nearly 50 mpg in MY 1986 (when the most efficient car was the General Motors Sprint ER) and in MY 2000 (when the most efficient car was the original Honda Insight hybrid), and is now about 40 mpg. Hybrids have defined the “Best Car” line since MY 2000. The ratio of the highest-to-lowest fuel economy has increased from about three-to-one in MY 1975 to nearly five-to-one today, as the fuel economy of the least fuel efficient cars has remained roughly constant in comparison to the most fuel efficient cars whose fuel economy has nearly doubled since MY 1975.
The overall fuel economy distribution for trucks is narrower than that for cars, with a peak in the fuel economy of the most efficient truck in the early 1980s when small pickup trucks equipped with diesel engines were sold by Volkswagen and General Motors. As a result, the fuel economy range between the most efficient and least efficient truck peaked at about 25 mpg in the early 1980s. The fuel economy range for trucks then narrowed, and is now about 20 mpg. Like cars, half of the trucks built each year have always been within a few mpg of each year’s average fuel economy value.
All of the above data are adjusted, combined city/highway CO2 emissions and fuel economy values for the combined car and truck fleet. Table 10.1 provides, for the overall car and truck fleets, adjusted and unadjusted, laboratory values for city, highway, and combined city/highway. Appendices B and C provide more detailed data on the distribution of adjusted fuel economy values by model year.
Table 2.3 shows the highest fuel economy gasoline and diesel vehicles for the MY 1975-2014 time frame (while the Trends report database began in MY 1975, we are confident that these are also the highest fuel economy values of all time for mainstream vehicles in the U.S. market). Note that alternative fuel vehicles, such as electric and plug-in hybrid electric vehicles, are excluded from this table (see Section 7 for information on alternative fuel vehicles). See Appendix A for a listing of the highest and lowest fuel economy vehicles, based on unadjusted fuel economy values, for each year since 1975.
Unadjusted, laboratory fuel economy (weighted 55% city/45% highway) values are used to rank vehicles in Table 2.3, since the test procedures and methodology for determining unadjusted, laboratory fuel economy values have remained largely unchanged since 1975. Accordingly, unadjusted, laboratory values provide a more equitable fuel economy metric, from a vehicle design perspective, over the historical time frame, than the adjusted fuel economy values used throughout most of this report, as the latter also reflect changes in real world driving behavior such as speed, acceleration, and use of air conditioning.
About the US Environmental Protection Agency (EPA)
www.epa.gov
“The mission of EPA is to protect human health and the environment. EPA’s purpose is to ensure that: all Americans are protected from significant risks to human health and the environment where they live, learn and work; national efforts to reduce environmental risk are based on the best available scientific information; federal laws protecting human health and the environment are enforced fairly and effectively…”
Tags: cars, CO2, Efficiency, Emissions, Environmental Protection Agency, EPA


 RSS Feed