UNITED STATES ENERGY INFORMATION ADMINISTRATION
Summary of Results
Power sector CO2 emissions declined by 363 million metric tons between 2005 and 2013, due to a decline in coal’s generation share and growing use of natural gas and renewables, but the CO2 emissions are projected to change only modestly from 2013 through 2040 in the 3 baseline cases used in this report. Relative to the AEO2015 Reference case, the projected emissions trajectory is somewhat lower in the High Oil and Gas Resource case baseline, which has cheaper natural gas, and somewhat higher in the High Economic Growth case, which has higher electricity use.
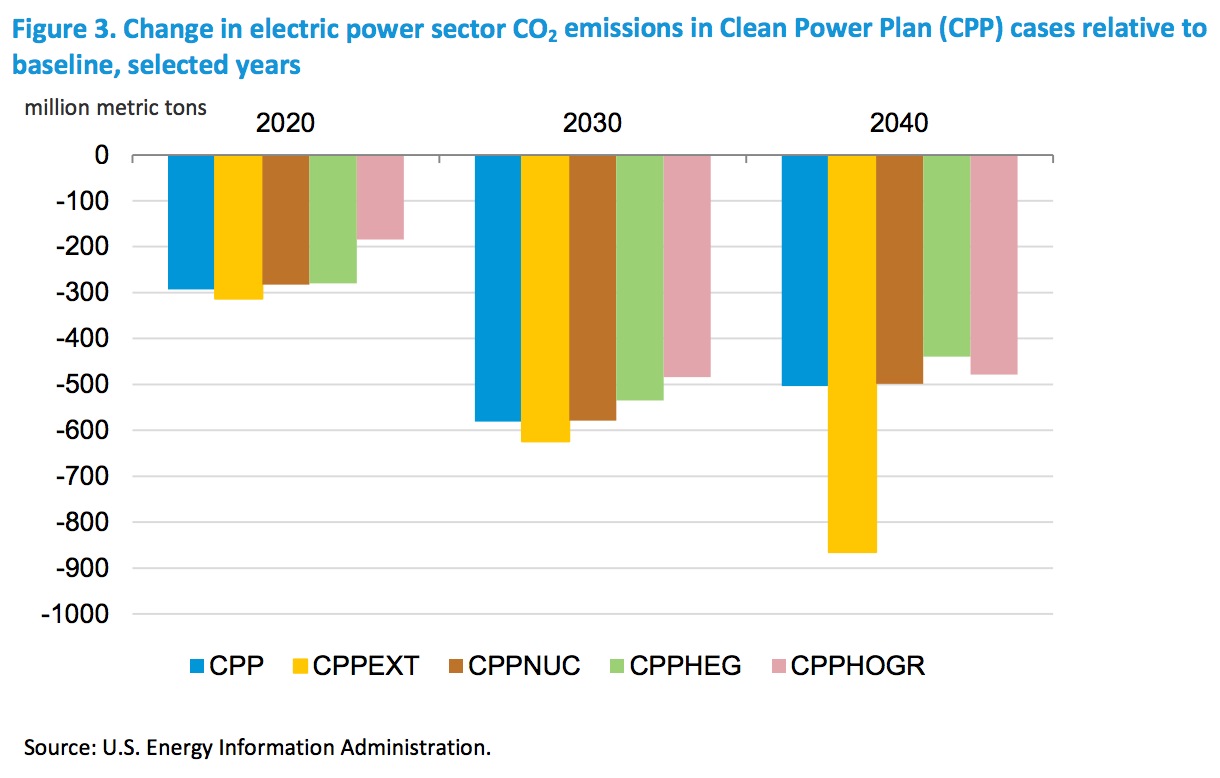
The proposed Clean Power Plan would reduce projected power sector CO2 emissions (Figure 3, Table 3 and Table 4). Reductions in projected emissions in 2030 relative to baseline projections for that year range from 484 to 625 million metric tons. The projected power sector emissions level in 2030 ranges from 1,553 to 1,727 million metric tons across the cases, reflecting a reduction of between 29% and 36% relative to the 2005 emissions level of 2,416 million metric tons.
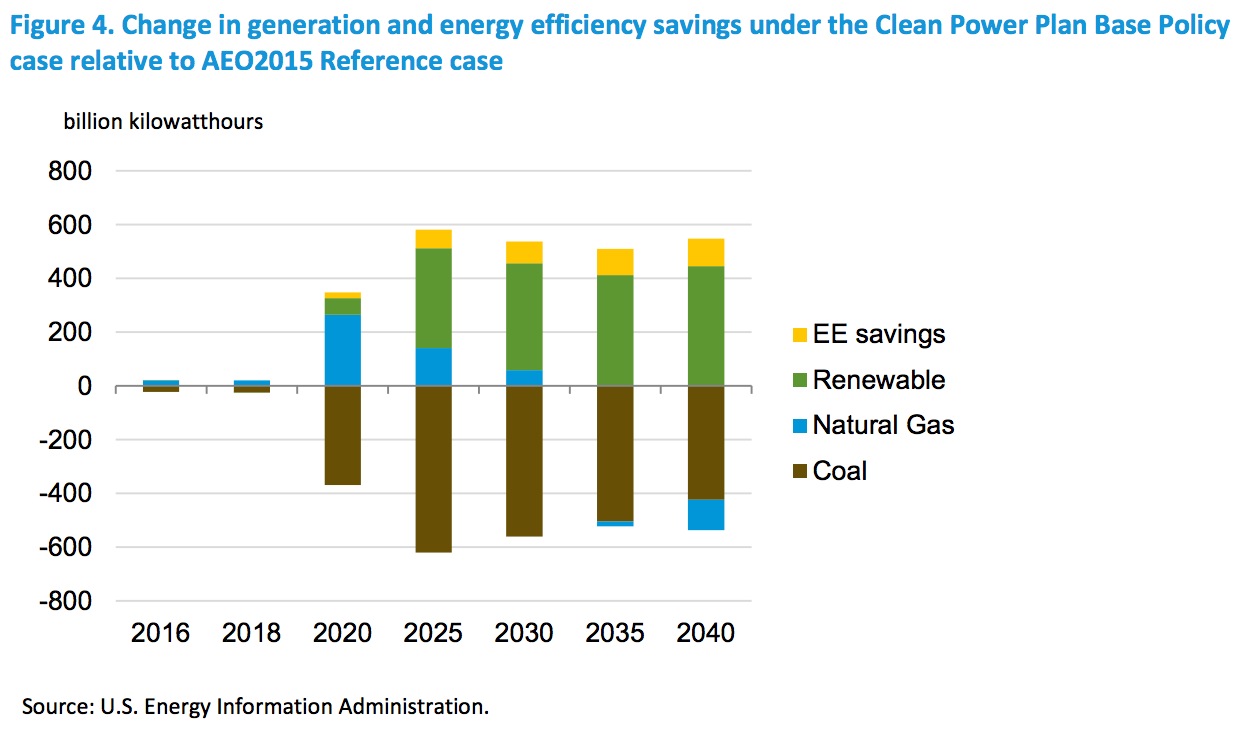
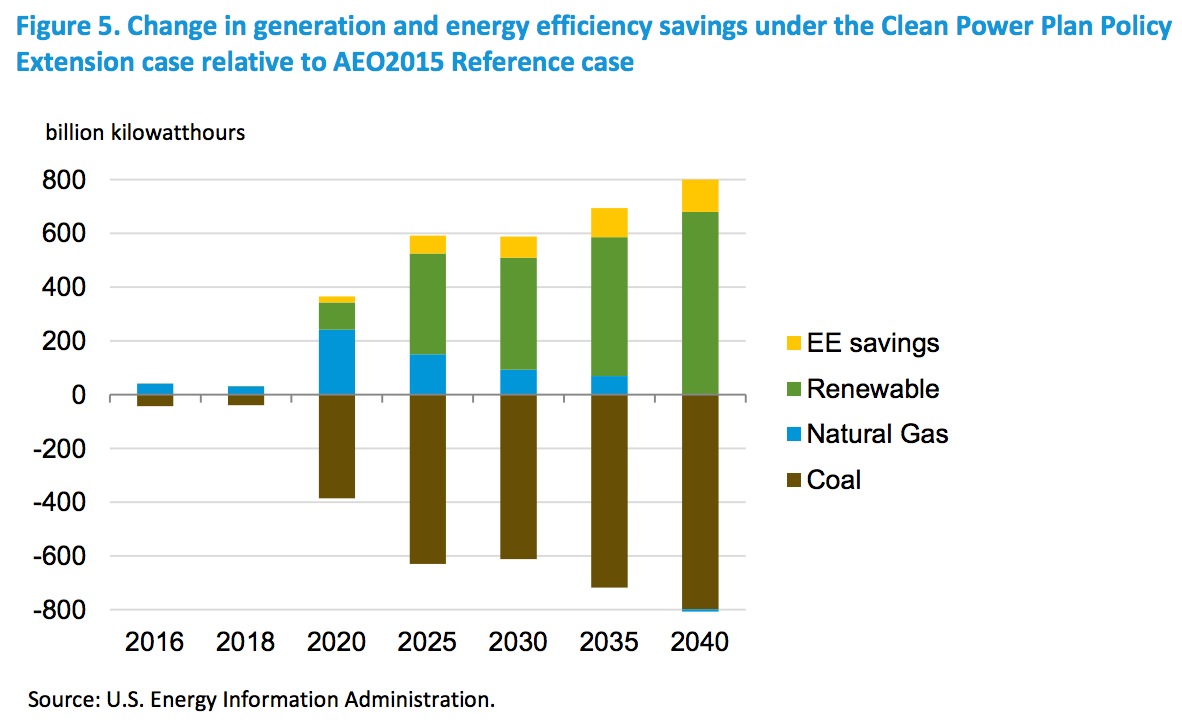
Switching from coal-fired generation to natural gas-fired generation is the predominant compliance strategy as implementation begins, with renewables playing a growing role in the mid-2020s and beyond (Figures 4 and 5; Tables 3 and 4). Demand-side energy efficiency plays a moderate role in compliance, relative to the early role of natural gas and the eventual role of renewables. The economics of increased natural gas generation and expanded renewable electricity capacity vary regionally, the key determinants being: 1) the natural gas supply and combined cycle utilization rates by region; and 2) the potential for penetration of renewable generation in regions including states that have no (or low) renewable portfolio standards.
With continued Clean Power Plan emissions reduction requirements through 2040 under the Policy Extension Case (CPPEXT), the shift to higher natural gas-fired generation is maintained through 2030- 35 (Figure 5 and Table 3).
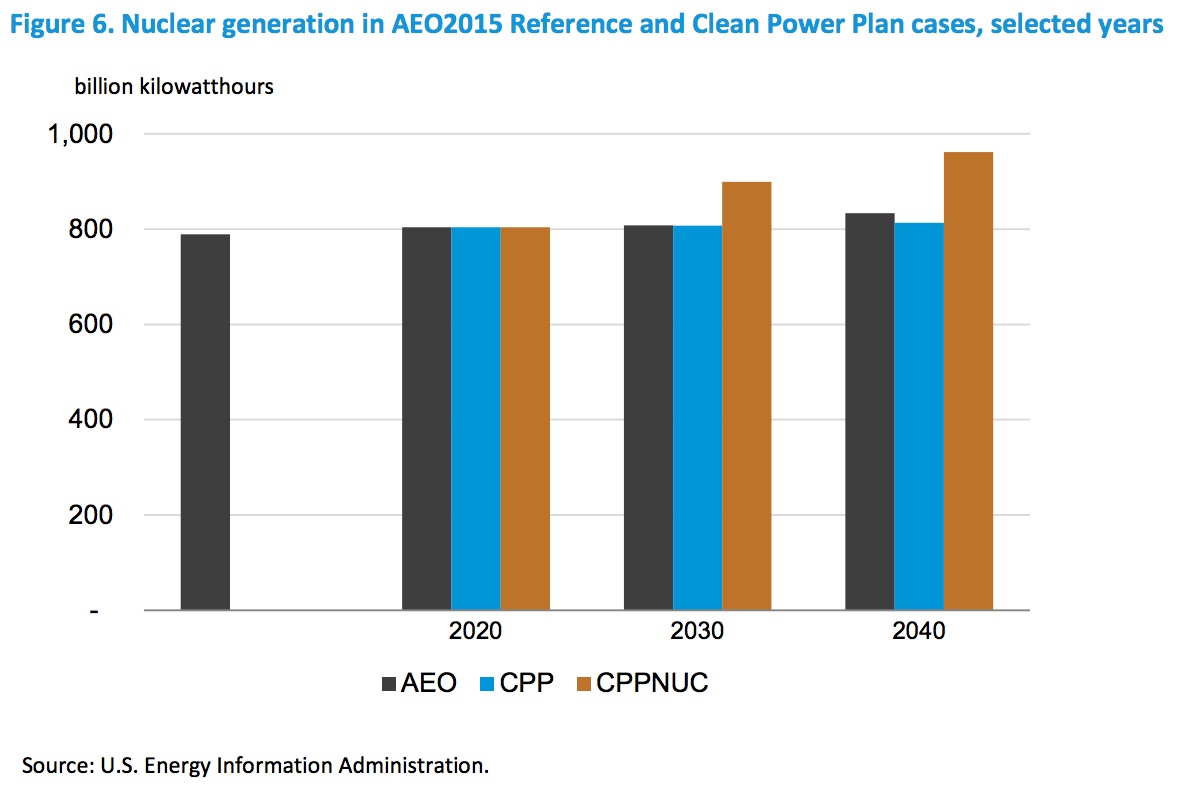
If new nuclear power generation were to be treated in the same manner as new renewable generation in compliance calculations, the Clean Power Plan would also result in increased nuclear generation (Figure 6 and Table 3).
The Clean Power Plan has a significant effect on projected retirements and additions of electric generation capacity (Figures 7 and 8; Tables 3 and 4). Projected coal plant retirements over the 2014- 40 period, which are 40 GW in the AEO2015 Reference case (most before 2017), increase to 90 GW (nearly all by 2020) in the Base Policy case (CPP). Retirements of inefficient units fueled by natural gas or oil, generally involving primary steam cycles, are also projected to rise. Turning to additions, which are dominated by natural gas and renewables over the 2014-40 period in the AEO2015 Reference case, the Clean Power Plan significantly increases projected renewable capacity additions in all cases. Under favorable natural gas supply conditions, the Clean Power Plan also increases additions of generation capacity fueled by natural gas (CPPHOGR). Nuclear capacity is also added in a sensitivity case in which new nuclear generation receives the same treatment as new renewable generation in compliance calculations (CPPNUC).
Download full version (PDF): Analysis of the Impacts of the Clean Power Plan
About the United States Energy Information Administration
www.eia.gov
The U.S. Energy Information Administration (EIA) collects, analyzes, and disseminates independent and impartial energy information to promote sound policymaking, efficient markets, and public understanding of energy and its interaction with the economy and the environment.
Tags: EIA, Energy efficiency, United States Energy Information Administration


 RSS Feed