RESEARCH AND INNOVATIVE TECHNOLOGY ADMINISTRATION
BUREAU OF TRANSPORTATION STATISTICS
Overview
The U.S. marine transportation system handles large volumes of domestic and international freight in support of the Nation’s economic activities. As a vital part of that system, the Nation’s container ports handle cargo and are sources of employment, revenue, and taxes for businesses or communities where they are located.
This report provides an overview of the movement of maritime freight handled by the Nation’s container ports in 2009 through mid-2010, based on the most current available data through that time period. It summarizes trends in maritime freight movement since 1995, especially during the last 5 years. It also covers the impact of the recent U.S. and global economic downturn on container traffic; trends in container throughput; concentration of containerized cargo at the top U.S. ports; regional shifts in cargo handled, vessel calls, and port capacity; the rankings of U.S. ports among the world’s top ports; and the number of maritime container entries into the United States relative to truck and rail containers. The report also includes spotlight summaries of landside access to container ports and maritime security initiatives.
The principal findings of the report are discussed below:
RECENT TRENDS
- In the first half of 2010, U.S. container ports handled a total of 110 million metric tons of containerized cargo, 17 percent higher than the 95 million metric tons handled in the same period in 2009, but down 8 percent from the 120 million metric tons handled in 2008.
- Both U.S. containerized exports and imports rose during the first half of 2010, as U.S. businesses replenished low inventories and production activities increased. Despite this upturn, maritime container exports for the first half of 2010 were down 6 percent from 2008 levels and container imports were down 9 percent.
- The growth in cargo activity at U.S. container ports during the beginning of 2010 followed a challenging year in 2009, when the tonnage of container cargo handled by the Nation’s ports fell by 10 percent when compared to 2008.
- The growth in container traffic in early 2010 affected various sectors of the freight transportation sector. During the first half of 2010, active containership capacity worldwide reached 13 million TEUs (20-foot equivalent units—a measure for counting containers), up 15 percent from the previous 6 months, as the number of idled vessels fell and new vessels were delivered for service.
- The number of intermodal shipping containers and truck trailers transported nationwide on railcars by U.S. Class I railroads during January to June of 2010 was 5.2 million units, up 12 percent from 4.6 million moved by rail during the same period in 2009, but down 7 percent from 5.6 million in 2008.
- In 2009, the most recent period for which global data are available, worldwide container TEUs declined 15 percent, compared to 2008.
- Despite recent fluctuations, today 1 container in every 11 that is engaged in global trade is either bound for or originates in the United States, accounting for 9 percent of worldwide container traffic.
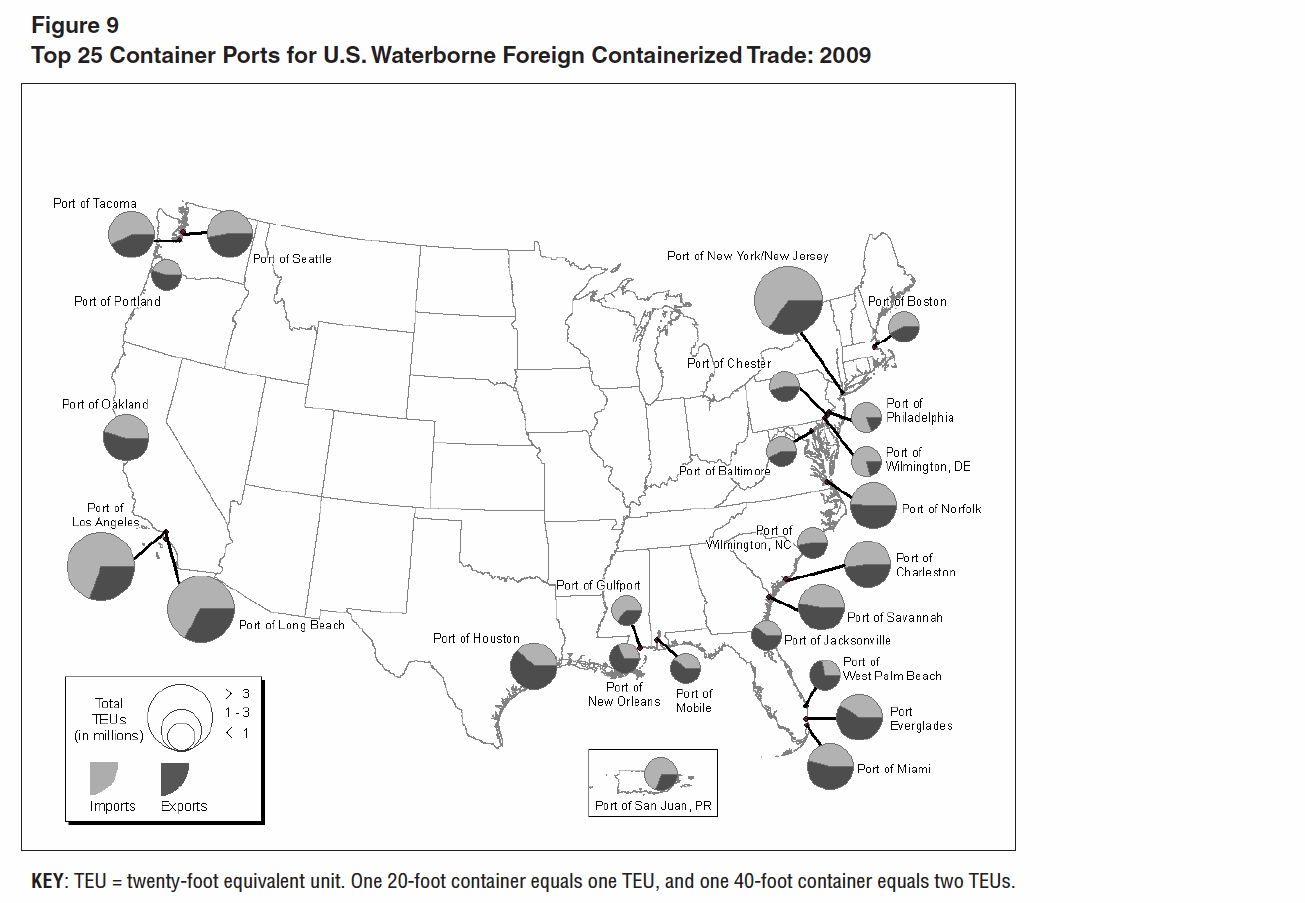
- U.S. container ports handle more TEUs of imports than exports, although the percentage of exports has increased during the most recent 3 years. In 2009, maritime container imports passing through U.S. seaports accounted for 58 percent of total container traffic, down from its peak of 67 percent in 2006.
- On a typical weekday in 2009, U.S. container ports handled an average of 68,000 TEUs of freight, up from 37,000 TEUs per day in 1995, but down from the peak of about 78,000 in 2007.
- In 2009, the top 10 U.S. container ports accounted for 85 percent of U.S. containerized TEU imports and exports, up from 78 percent in 1995.
West coast ports as a region grew the fastest of any port region between the mid-1980s and 2009, but since 2007 the region has experienced the sharpest decline in container traffic. Between 2007 and 2009, total TEUs handled by west coast ports declined 22 percent, compared with 13 percent decline for east coast ports and less than 1 percent increase for gulf coast ports.
Download full report (PDF): America’s Container Ports
About the Bureau of Transportation Statistics
www.bts.gov
“The BTS mission is to create, manage, and share transportation statistical knowledge with public and private transportation communities and the Nation. The main purpose of BTS’ work is to help advance the DOT Strategic Plan (2006-2011). But we also aim to anticipate future needs and policy issues. Our challenge is to develop data and analyses that are relevant, high quality, timely, comparable, complete, and accessible-our strategic goals for transportation statistics.”
Tags: BTS, Bureau of Transportation Statistics, Freight, Ports, Research and Innovative Technology Administration, RITA


 RSS Feed