TRANSPORTATION RESEARCH AT THE UNIVERSITY OF CALIFORNIA
Retrofitting Suburbs to Increase Walking
During the last half of the 20th century, cities and towns across America were built primarily for one transportation mode: the automobile. Much of this development occurred on the urban periphery, creating the suburbs that are now home to more Americans than either traditional central cities or small towns. Today, while federal transportation policies and urban planners have shifted toward promoting a more multi-modal form of development, the legacy of the postwar era remains: thousands of suburban neighborhoods poorly served by any mode of transportation other than the automobile.
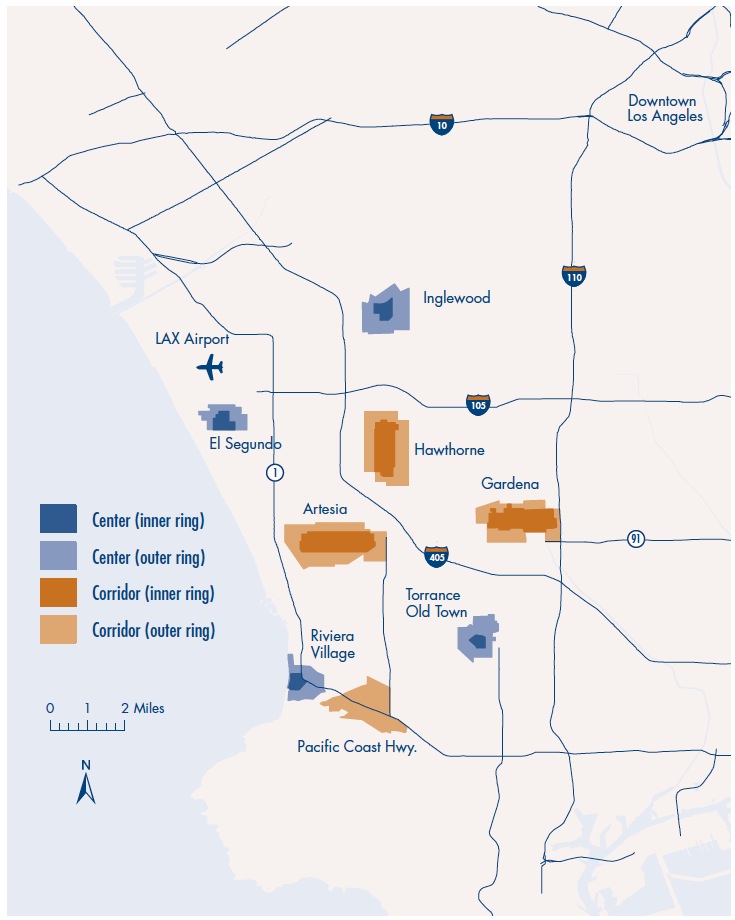
Researchers have spilled much ink debating the feasibility of alternatives to car travel, but have focused less on how suburbs built for the car might be transformed to accommodate other modes. Seven years ago, communities in the South Bay area of Los Angeles County decided to focus on this question. They found that walking is the gateway mode for alternative transportation. The 2009 National Household Travel Survey shows that 10 percent of all trips in the US are taken on foot. Relatedly, an American Public Transportation Association analysis of over 150 on-board transit surveys from 2000 to 2005 showed that walking is the access mode for about 60 percent of all transit trips.
Walking travel and land use patterns vary substantially within the South Bay. Analyzing the correlates of walking in that area provides insight into ways to retrofit auto-oriented suburbs for more pedestrian travel.
…
Beyond Rationality in Travel Demand Models
The effectiveness of transportation policies will depend on how users respond to them. Therefore, we must understand how to predict and influence behavior over the long term, which is the realm of travel demand modeling. Relevant decisions made by individuals include where to live and work; the type and quantity of vehicles and transit passes to own; the types, locations and scheduling of activities; and by what modes and routes one travels to those activities. This article explores ways to improve travel demand models to reflect actual behavior, whether it is “rational” or not.
The statistical models used for predicting transport-related behaviors are predominantly rooted in the microeconomic paradigm of rationality, which assumes that people can accurately calculate and compare the value of options and then follow the best possible course of action. But are people rational when it comes to making transportation decisions? Are you aware of all of your transportation alternatives? Do you understand and weigh travel times, monetary costs and reliability by mode? Do you choose the alternative with the minimum generalized cost calculated solely from travel times and monetary costs? Or are there other factors that influence your decision such as comfort, convenience, habits, values, or peer influences?
Behavioral science researchers have a long history of raising serious questions about the rationality assumption. Their research has often succeeded in pointing out seemingly inconsistent and non-sensible choices. For example, an experiment in the 1970s conducted by behavioral economists Daniel Kahneman and Amos Tversky found that, while most people would travel an extra 15 minutes to save $7 on a new pen, most people would not travel an extra 15 minutes to save $7 on a new suit. An assumption of rationality would suggest that $7 should equal $7 regardless of context. While this behavior is perhaps irrational by some definitions, it is bias in a predictable and measureable direction if what matters is the magnitude of the savings relative to the cost of the item.
…
The Davis Bicycle Studies
Pick a city, any city in the US, and then pick a house within that city. Open the door of its garage and you’re likely to find a bicycle. Chances are good that it is covered with dust or has a flat tire. If not, and if its owner has in fact used it any time recently, odds are the purpose was exercise or recreation. Compare this to a garage, any garage, in Davis, California. Inside you’re likely to find several bicycles—more bicycles, perhaps, than people living in that house. In all probability, one or more of those bicycles is used at least weekly, not for exercise or recreation but for transportation—to get the rider to work, school, the store, a restaurant, or another destination in town. Davis is one of the few places in the US where bicycling is a substantial mode of transportation. With the goal of helping other communities in their efforts to promote this low-cost, low-polluting, health-promoting mode, my students and I have undertaken a series of studies over the last five years to understand bicycling in Davis.
Davis gained a reputation as a bicycle-friendly town as early as the 1950s. The city has many natural advantages for bicycling: it is flat, compact, and has favorable weather for much of the year. But its bicycle friendliness also reflects concerted policy efforts. Plans for an expanded University of California campus in Davis in the late 1950s featured extensive bicycle paths. A few years later, a Davis family returning from a year in the Netherlands inspired city officials to embrace bicycling. In 1967, the city striped the first bicycle lanes in the US. In the years that followed, city staff experimented with a variety of designs for bicycle facilities and for accommodating bicycles at traffic signals.
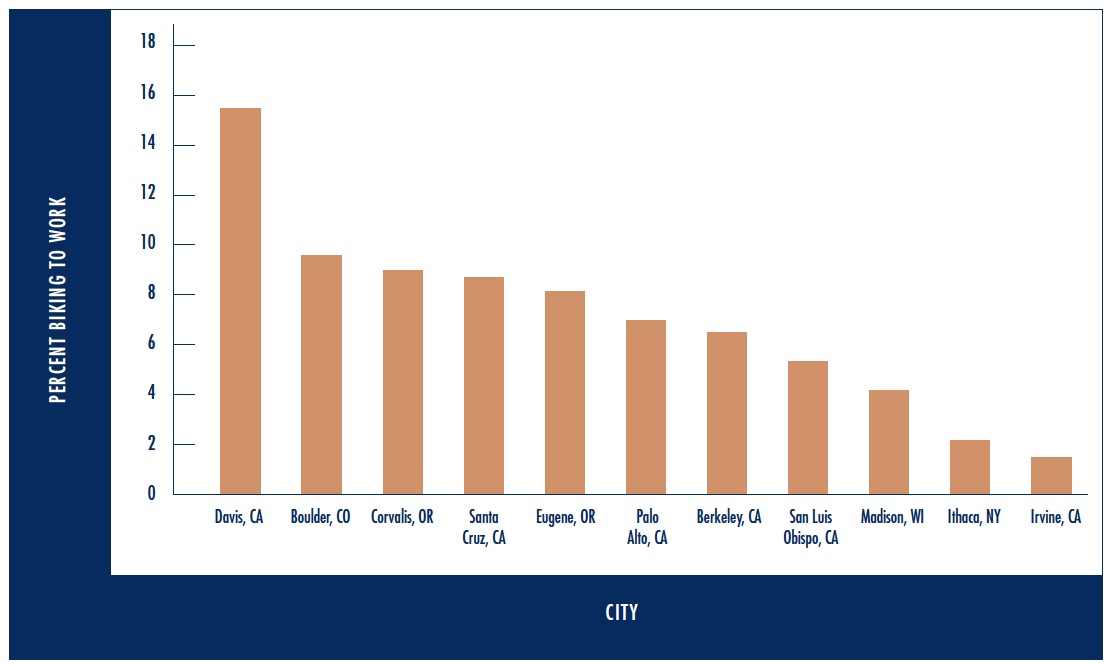
Meanwhile, the university invented the bicycle roundabout, now used at other schools, to handle the large number of bicyclists on campus. Today, Davis has over 50 miles of on-street bike lanes and over 50 miles of off-street bike paths in an area of less than ten square miles, with 25 dedicated bike bridges and tunnels. This infrastructure supports a substantial amount of bicycling. According to the latest American Community Survey data, over 15 percent of Davis workers usually commute to work by bicycle. Our own surveys provide even more impressive numbers. According to the 2010–11 Campus Travel Survey for UC Davis, 46 percent of faculty and 40 percent of staff who live in Davis commute to campus by bicycle, as do 47 percent of undergraduates and 55 percent of graduate students. Our 2006 survey of adults in Davis and five comparison cities showed that 53 percent of Davis residents bicycled at least once in the previous week. Of those who biked, over half did so for transportation rather than recreation. In 2009, we surveyed students at Davis High School and found that just over one third usually bicycle to school. The same year, counts of bicycles in the racks at elementary schools in the city found that the share of students bicycling to some schools is as high as 25 percent. When we surveyed parents at Saturday morning soccer games in 2006, nearly 20 percent reported that their children had bicycled to the game. In comparison, less than 1 percent of daily trips in the US are by bicycle.
Download full report (PDF): ACCESS: Issue 39
About Transportation Research at the University of California
www.uctc.net
“The University of California Transportation Center (UCTC) is a multi-campus organization headquartered on the UC Berkeley campus.
UCTC carries out basic and applied research, published in journals and on the Center’s web site. UTCs are asked to identify a “theme”, and the UCTC theme is transportation systems analysis and policy.”
Tags: ACCESS Magazine, Transportation Research at the University of California, UCTC


 RSS Feed