ACCESSIBILITY OBSERVATORY, UNIVERSITY OF MINNESOTA
Executive Summary
Accessibility is the ease of reaching valued destinations. Accessibility can be measured for various transportation modes, to different types of destinations, and at different times of day. There are a variety of ways to define accessibility, but the number of destinations reachable within a given travel time is the most comprehensible and transparent—as well as the most directly comparable across cities. This report focuses on accessibility to jobs by transit. Jobs are the most significant non-home destination, but it is also possible to measure accessibility to other types of destinations. Transit is used for an estimated 5% of commuting trips in the United States, making it the second most widely used commute mode after driving.
This study estimates the accessibility to jobs by transit in 46 of the 50 largest (by population) metropolitan areas in the United States using transit schedules from January 2014. Some metropolitan areas are excluded due to a lack of available transit schedule data; these are Jacksonville, Memphis, Oklahoma City, and Richmond.
Travel times by transit are calculated using detailed pedestrian networks and full transit schedules for the 7:00 – 9:00 AM period. The calculations include all components of a transit journey, including “last mile” access and egress walking segments and transfers, and account for minute-by-minute variations in service frequency.
Rankings are determined by a weighted average of accessibility, giving a higher weight to closer jobs. Jobs reachable within ten minutes are weighted most heavily, and jobs are given decreasing weights as travel time increases up to 60 minutes. Based on this measure, the 10 metro areas with the greatest accessibility to jobs by transit, and for which sufficient data are available, are:
1. New York
2. San Francisco
3. Los Angeles
4. Washington
5. Chicago
6. Boston
7. Philadelphia
8. Seattle
9. Denver
10. San Jose
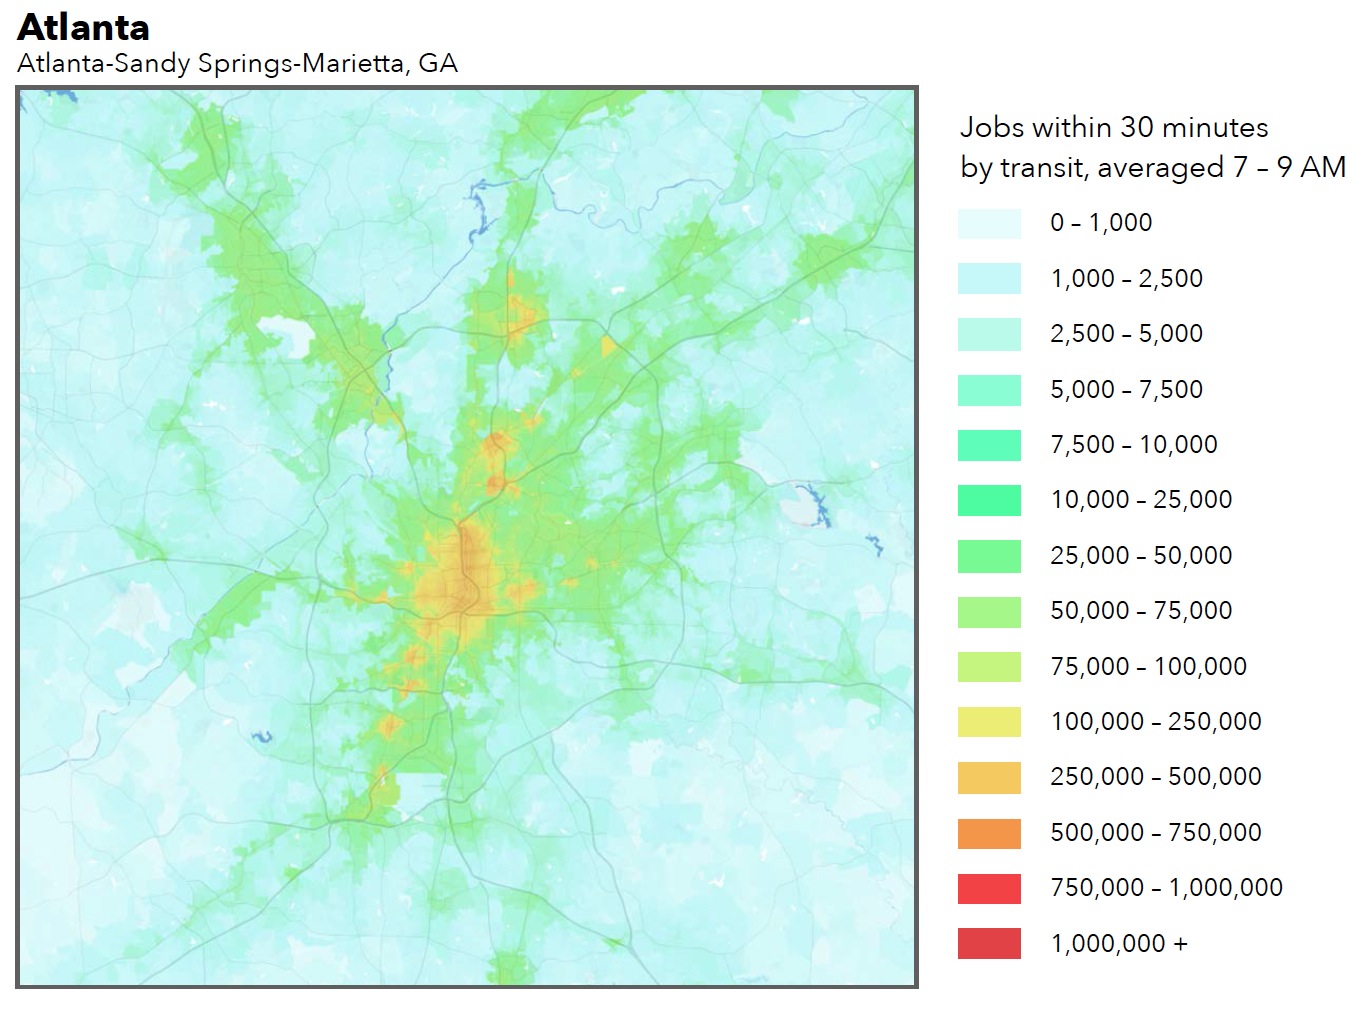
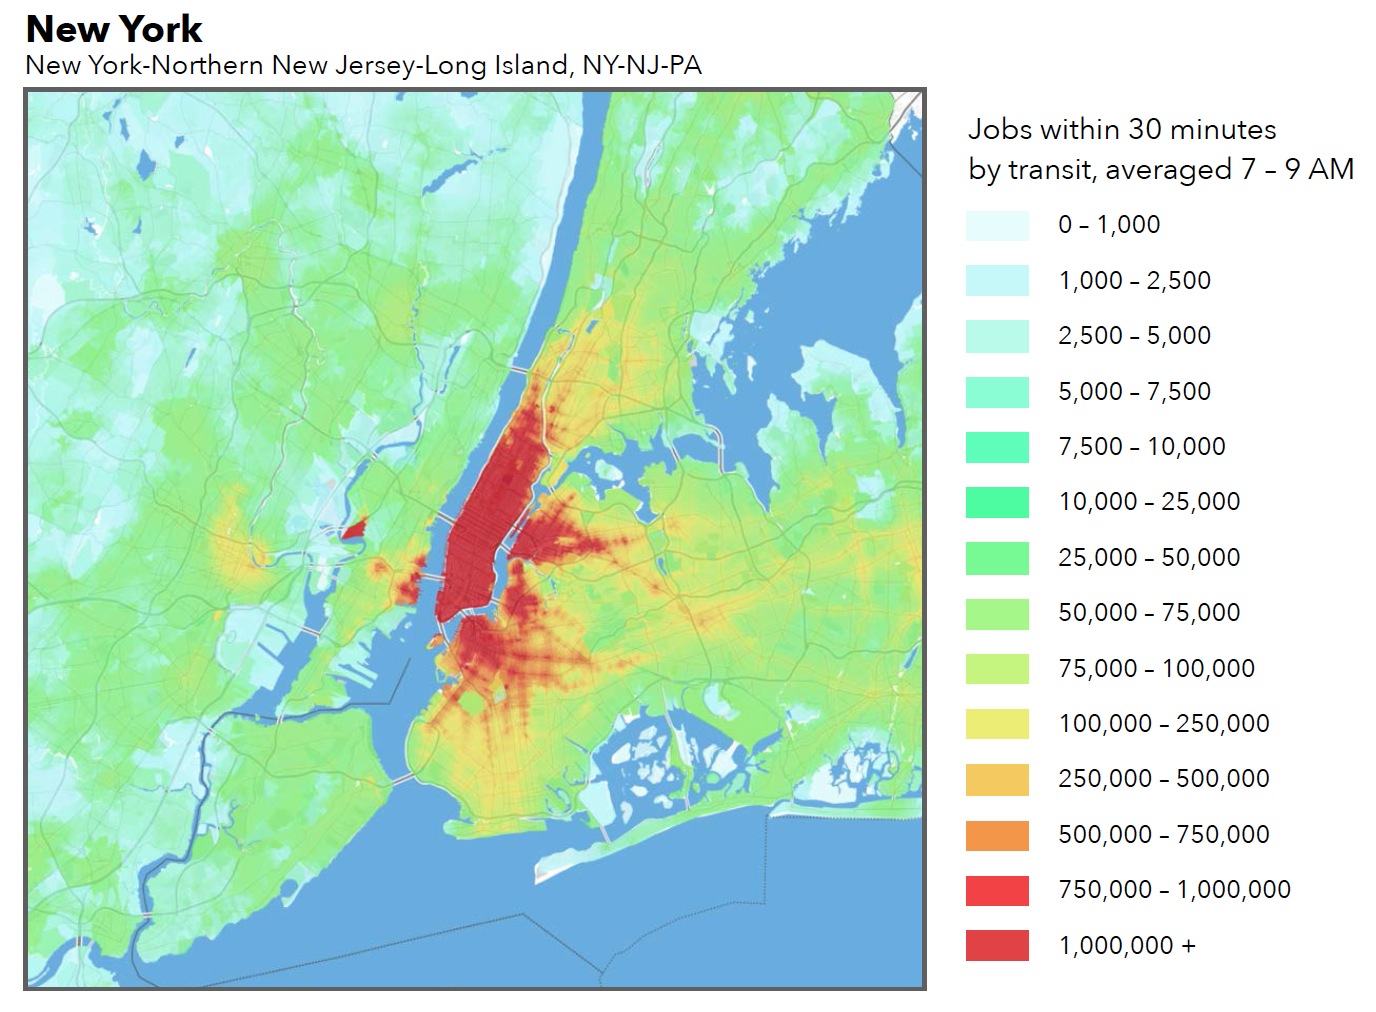
This report presents detailed accessibility values for each metropolitan area, as well as block-level maps that illustrate the spatial patterns of accessibility within each area. A separate publication, Access Across America: Transit 2014 Methodology, describes the data and methodology used in this evaluation.
Download full version (PDF): Access Across America
About the Accessibility Observatory
access.umn.edu
The Accessibility Observatory at the University of Minnesota is focused on the research and application of accessibility-based transportation system evaluation. The Observatory is guided by a threefold mission: to advance the field of transportation system evaluation through research of new data sources and methods for accessibility evaluation; to develop standards and tools to facilitate the use and communication of accessibility-based metrics in transportation planning, engineering, and evaluation; and to apply our tools and expertise in support of continual improvements in the planning, design, engineering, and analysis of transportation systems.
Tags: Accessibility, Accessibility Observatory, Pedestrian, University of Minnesota


 RSS Feed