SOLAR ENERGY INDUSTRIES ASSOCIATION
1. Introduction
The U.S. solar market is increasingly becoming a central focus of global industry attention, but state-by-state differences in regulations, incentives, utilities, and financing structures introduce more complexities in comparison to other markets. As a result, it has long been difficult to track and understand the changing market dynamics for solar energy in the U.S.
The SEIA/GTM Research U.S. Solar Market Insight is our answer to this problem. Each quarter, we survey installers, manufacturers, utilities, and state agencies to collect granular data on photovoltaics (PV), concentrating solar power (CSP), and solar heating & cooling (SHC). This data provides the backbone of Solar Market Insight, in which we identify and analyze trends in U.S. solar demand, manufacturing, and pricing by state and market segment. We also use this analysis to look forward and forecast demand over the next five years. As the U.S. solar market expands, we hope that Solar Market Insight will provide an invaluable decision-making tool for installers, suppliers, policymakers and advocates alike.
2. Photovoltaics (PV)
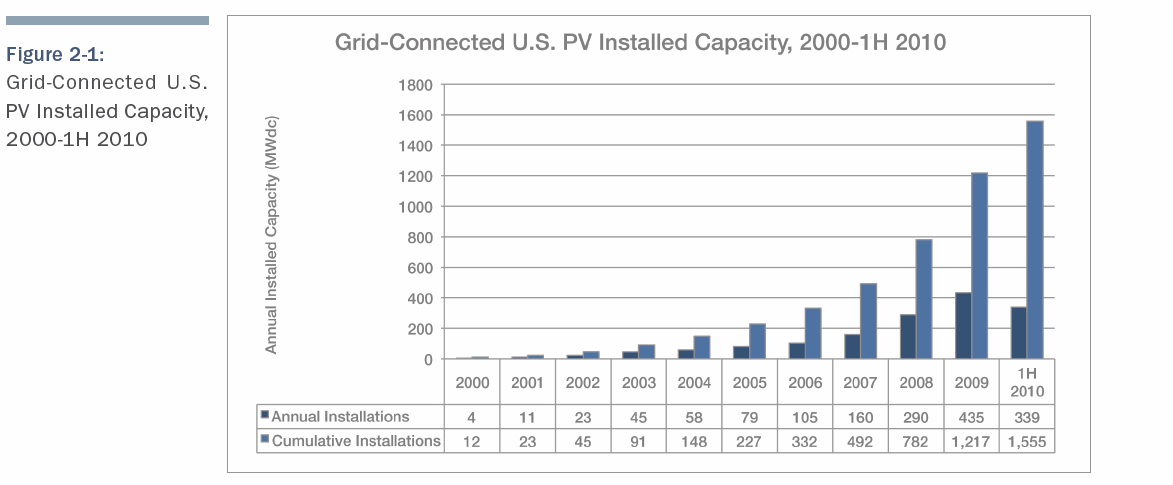
The U.S. PV market has grown at an average annual rate of 69% over the past ten years, rising from just 3.9 megawatts (MW) in 2000 to 435 MW in 2009. Despite this trend, the U.S. constituted only 6.5% of global PV demand in 2009, placing fourth in national installations behind Germany, Italy, and Japan. However, with continued pricing reductions and strong incentives the U.S. could become the next major PV growth market.
2.1 Installations
The United States is on track to experience a record year for PV installations in 2010. In the first half of the year 339 MW of grid-connected PV were installed. On an annual basis, this represents 55% growth over the 435 MW installed in 2009. Many factors contributed to this growth, including a drastic decline in 2009 module prices, continued federal support from the Section 1603 Treasury Cash Grant in Lieu of Investment Tax Credit program, and expanding state-level targets for solar power.
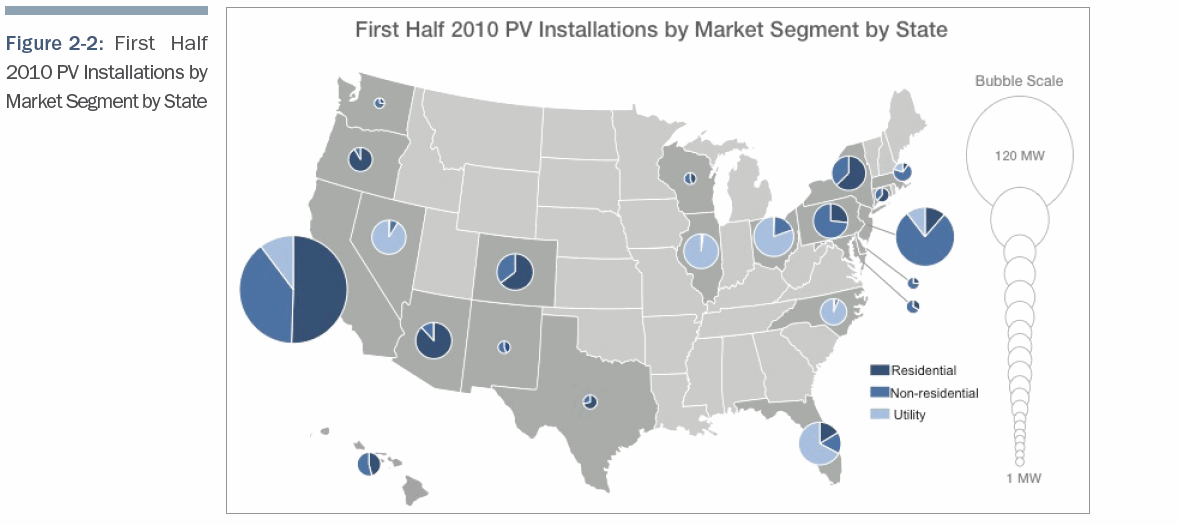
Nearly all of the top 20 states experienced demand growth in the first half of 2010, although the pace of growth varied highly from state to state. California and New Jersey remained the largest state markets, but nine other states installed at least 10 MW in the first half of the year.
We anticipate that the second half of 2010 will be even stronger than the first. Many projects will rush to commence construction in order to meet eligibility deadlines for the cash grant program, and some of these projects will ultimately be connected to the grid within the year.
Both the residential and non-residential segments show continued signs of strength, and the available supply of financeable modules has increased in the second half as the German market has begun to cool off. In addition, a number of large-scale utility projects (>20 MW) are currently in construction and anticipated to reach completion by the end of 2010.
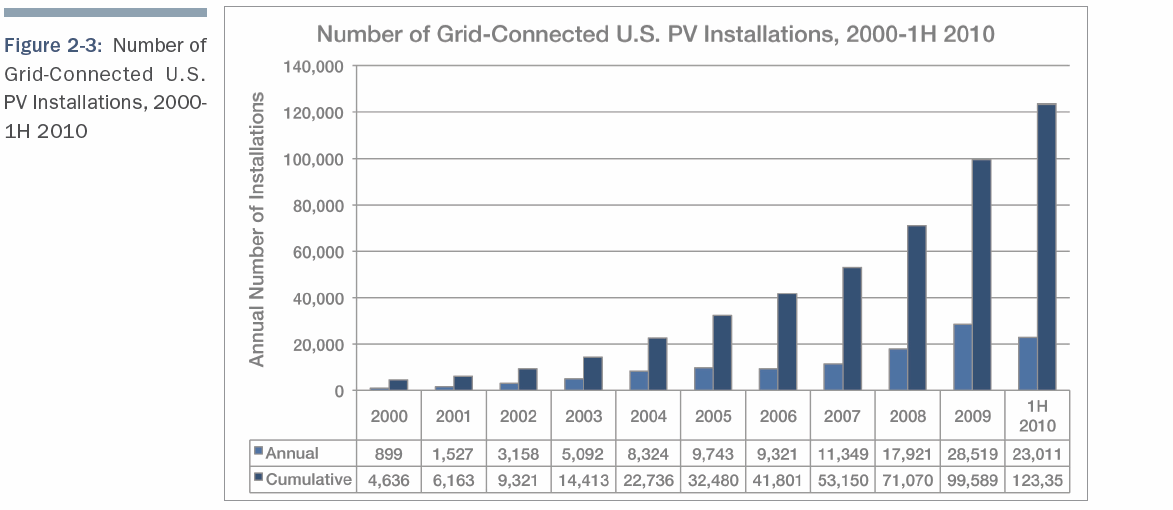
Over 23,000 PV systems were installed in the first half of the year, including an unprecedented 22 utility projects (on the utility side of the meter). This compares to roughly 28,000 systems installed in all of 2009. In total, over 120,000 systems have been connected to the grid in the United States through the first half of 2010, including over 100,000 residential systems. Five states each installed more than 1,000 systems in the first half, including Arizona, California, Colorado, New Jersey, and New York.
Tags: photovoltaic, PV, SEIA, Solar Energy, Solar Energy Industries Association, Solar Power, U.S. Solar Market Insight


 RSS Feed