


UITP
Introduction
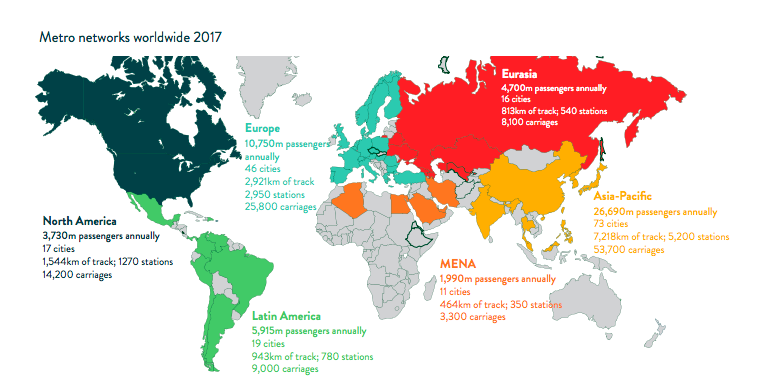
Metros are of critical importance for mobility, as societies are becoming ever more urbanised. At the end of 2017, there were metros in 182 cities in 56 countries, carrying on average a total of 168 million passengers per day. 75 new metros have opened since the year 2000 (+70%). This massive growth is to be credited largely to developments in a few countries in Asia.
For this new metro Statistics Brief UITP has collected exhaustive data for a series of key indicators for all metros in the world including ridership, number of lines, network length, number of stations and – new for this edition – fleet size. Extensive data was also collected for another new field: infrastructure construction model (underground, elevated, at grade or in trench).
Ridership
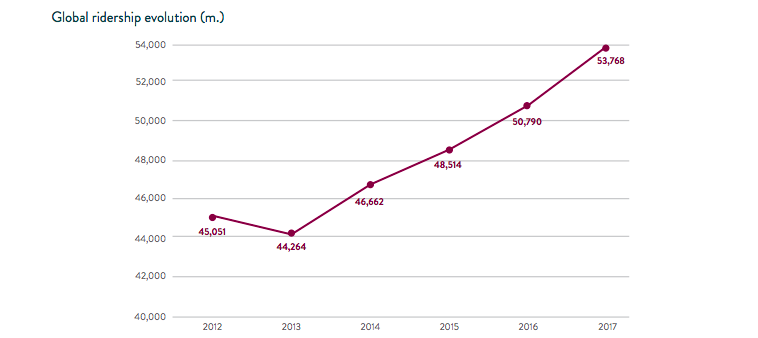
In 2017, the 182 metro systems accounted for a total annual ridership of 53,768 million passengers. In the last six years, annual metro ridership grew globally by 8,716 million passengers (+19.5%).
Broken down by continent, the ridership growth rate between 2012 and 2017 was the most robust in the MENA region (+58%), followed by Asia (+28%) and Latin America (+20%). North America and Europe recorded a 10% increase, while Eurasia lost 3% of passengers.
Closer analysis of North American data reveals that the moderate growth apparent at the regional level hides a contrasting situation, with Canadian metros and New York growing significantly (in a range of 5-46%), while the other 13 metros showing a decrease in passengers.
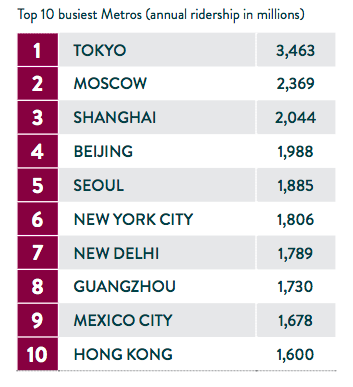
Asia is home to no less than seven of the top 10 busiest metros. Compared to the 2015 UITP Metro Statistics Brief, New Delhi joined the Top 10 group, replacing Paris. Beijing, Shanghai, Seoul, Guangzhou and Mexico moved down in the ranking while Moscow climbed up to number two.
Ridership evolution was also analysed compared to the population in the served urban areas . Eurasia and Europe are the regions where metro services are most used “per capita”. All other regions are at a comparable level. Metros gained popularity in all regions except in North America (stable) and Eurasia (declined).
New Metro Cities
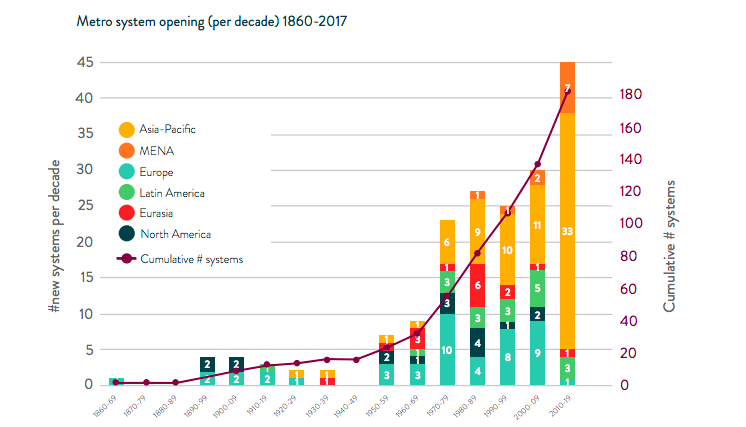
Looking at the history of metro development, there has never been such strong development since Asia started to massively invest in metros in the 1970s (see graph next page). There has been a significant surge in the current decade, which is not even finished, largely due to China and India.
Infrastructure
As of 31 December 2017, the 182 metro systems together made up an installed asset base of 642 lines for a total length of 13,903km and 11,084 stations (see distribution per region on map, page one).
1,901km of new infrastructure was put in revenue service between the start of 2015 and the end of 2017. This includes the new lines that opened in the 19 new metro cities in China, India and Iran (577km), but also new lines in already established metro cities (820km) as well as line extensions (504km).
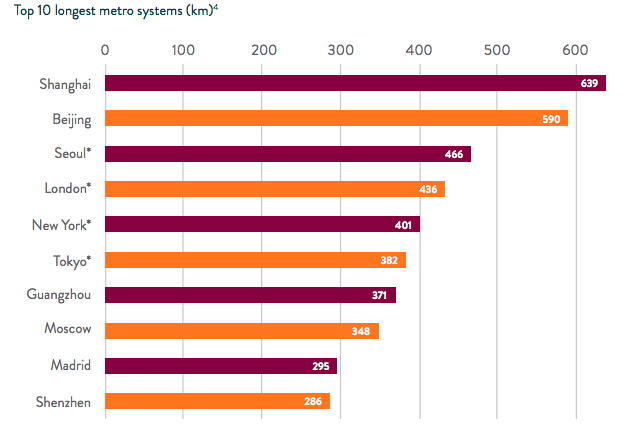
At the level of individual metros, compared to the situation at the end of 2014, Shenzhen joined the Top 10 of the longest metro systems, replacing Mexico City. Seoul climbed up one position to number three and Guangzhou climbed from number nine to number seven in the ranking. London, Moscow and Madrid all moved down one position.
Asia is home to no less than six of the top 10 longest metros.
Download full statistics brief (PDF): World Metro Figures 2018
About UITP:
www.uitp.org
UITP (Union Internationale des Transports Publics) is the International Association of Public Transport and a passionate champion of sustainable urban mobility. UITP is internationally recognised for its work to advance the development of this critical policy agenda. UITP has a long history to its name, and is the only worldwide network to bring together all public transport stakeholders and all sustainable transport modes.
Tags: ASIA, Mass Transit, Metro, metro systems, mobility, Ridership, UITP, urban mass transit systems
 RSS Feed