ABA FOUNDATION – AMERICAN BUS ASSOCIATION
Introduction
This analysis is intended to evaluate the environmental performance of Highway Motorcoach operations, by comparing the energy use and carbon dioxide (CO2) emissions of motorcoaches with the energy use and CO2 emissions of other common transportation vehicles/modes.
Including motorcoaches, a total of twelve transportation modes are included in the analysis, as follows:
Highway Motorcoach – According to the American Bus Association vehicles in the motorcoach fleet are designed for long-distance travel, and are characterized by “integral construction with an elevated passenger deck located over a baggage compartment”. For this analysis the motorcoach mode includes motorcoach buses used for private charters, tours/sightseeing, scheduled inter-city service, and airport and commuter service between a central city and adjacent suburbs/airports.
Private Automobile – for this analysis the private automobile mode includes all use of a personally-owned car or light truck for commuting and other travel.
Heavy Urban Rail – A transit mode that uses self-propelled electric-powered passenger cars operating on an exclusive rail right-of-way, either below or above-ground, to provide scheduled service within an urban area. Typically the system is designed to accommodate very high passenger volumes, and trains are operated in multi-car sets. The electricity to power the vehicles is drawn either from overhead wires or from a power rail.
Light Rail – A transit mode that uses self-propelled electric-powered passenger cars operating on an exclusive or shared above-ground rail right-of-way to provide scheduled service within an urban area. Typically the system is designed to accommodate lower passenger volumes than heavy rail, and passenger cars are operated singly or in two-car sets. The electricity to power the vehicles is drawn from overhead wires.
Commuter Rail – A transit mode that uses electric or diesel-powered locomotives pulling passenger cars, and operating on an exclusive rail right-of-way, for local short-distance travel between a central city and adjacent suburbs.
Intercity Rail – A transit mode that uses electric or diesel-powered locomotives pulling passenger cars, and operating on an exclusive rail right-of-way, for long-distance travel between cities.
Domestic Air Travel – Scheduled plane service operating between U.S. cities. For this analysis international air travel is not included.
Urban Transit Bus – A transit mode that includes the use of primarily diesel-powered, rubber-tired vehicles for fixed route scheduled service within an urban area, and usually operated in mixed traffic on city streets. The buses used for this mode are typically between 20 and 40 feet in length.
Electric Trolley Bus – A transit mode that uses electric-powered rubber-tired vehicles for fixed route scheduled service within an urban area, and usually operated in mixed traffic on city streets. Electricity to power the vehicles is drawn from overhead wires installed along the route.
Ferry Boat – A transit mode that uses marine vessels to carry passengers and/or vehicles over a body of water. Intercity ferryboat service is excluded, except for that portion of such service that is operated by or under contract with a public transit agency for predominantly commuter services.
Van Pool – A transit mode that uses vans, small buses and other vehicles, operating as a ride-sharing arrangement, to provide transportation to a group of individuals traveling directly between their homes and a regular destination within the same geographical area. For this analysis only vanpools operated by a public entity are included.
Demand Response – Shared-use transit service operating in response to calls from passengers to a transit operator, who schedules a vehicle to pick up the passengers to transport them to their destinations. This analysis only includes demand response service operated by public transit agencies, primarily to provide “para-transit” service to individuals with disabilities that preclude them from using fixed-route transit bus service. For this analysis the demand response mode does not encompass private taxis or private shared-ride van services.
This report is an update to a similar report issued in October 2008. This report uses updated 2011 and 2012 data not available for the previous report, but the results are similar to those reported in 2008.
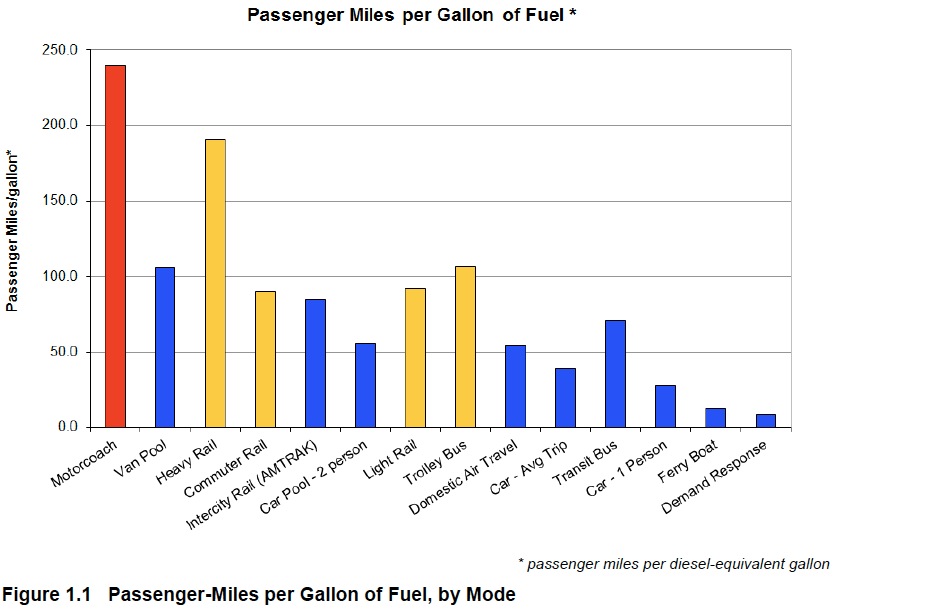
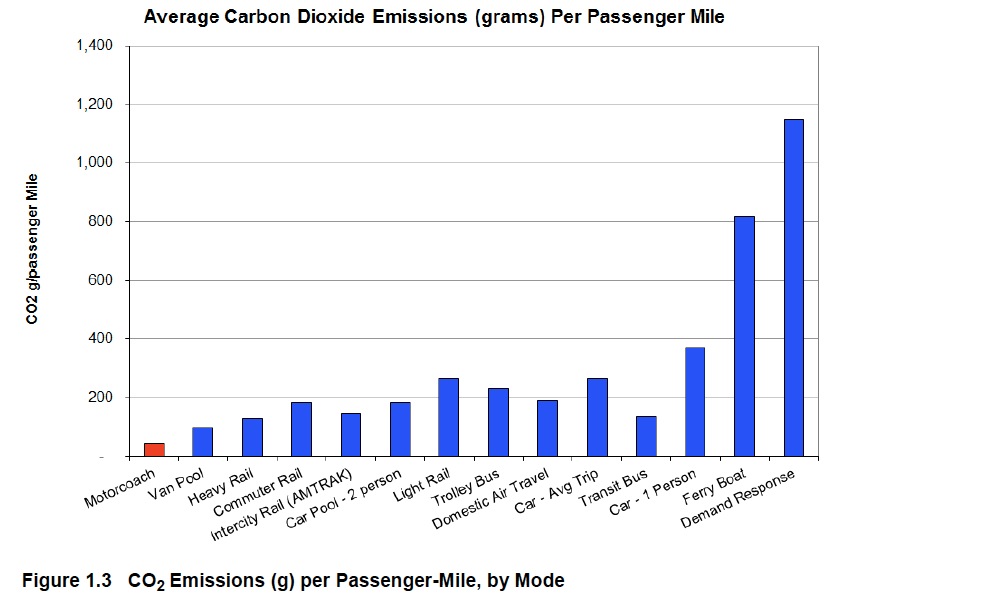
For all modes both energy use and CO2 emissions are expressed in terms of units per passenger mile operated. The metrics used for energy intensity are passenger miles per diesel-equivalent gallon1 (pass-mi/DEG) and btu2 per passenger mile (btu/pass-mi). The metrics used for CO2 emissions are grams of CO2 per passenger mile (g/pass-mi).
Carbon dioxide is a greenhouse gas that has been linked to global warming. The most significant source of U.S. CO2 emissions is the burning of fossil fuels such as coal, gasoline, diesel fuel and natural gas for electricity production, space heating, industrial processes, and transportation. The transportation sector is a significant contributor to total man-made CO2 emissions.
All of the data used for this analysis is publicly available. As discussed below the major sources of data include the Federal Transit Administration’s National Transit Database3; the Department of Transportation, Bureau of Transportation Statistics, National Transportation Statistics; and a Coach Industry Census conducted by John Dunham and Associates for the American Bus Association Foundation (ABAF).
About the ABA Foundation
www.buses.org/aba-foundation
“The ABA Foundation mission is to support the motorcoach travel and tour industry with research and scholarships that benefit the ABA, policymakers and the public.”
Tags: ABA Foundation, American Bus Association, CO2, Emissions


 RSS Feed