NATIONAL PHYSICAL ACTIVITY PLAN ALLIANCE
Objective of the 2017 United States Report Card on Walking and Walkable Communities
The primary goal of the 2017 United States Report Card on Walking and Walkable Communities (the Report Card) is to assess the extent to which the U.S. population and U.S. communities meet selected standards for participating in walking and providing physical and social supports for walking behavior. The 2017 Report Card is the first comprehensive, national assessment of walking and walkability in the U.S.
Methodology
 An expert panel, established by the Board of Directors of the National Physical Activity Plan Alliance, developed the U.S. Report Card on Walking and Walkable Communities. The following steps were involved in developing the Report Card:
Creation of the Panel. The Alliance established the Advisory Panel on Walking and Walkable Communities, which included members representing a wide range of expertise across multiple sectors. These included non-profit and for-profit organizations as well as academic institutions. All members brought extensive experience in promoting walking as part of the broad effort to increase physical activity in the U.S. population.
Initial Development of the Report Card. As a first step, the Panel identified the factors that best reflect the status of walking behavior in the United States and efforts to support walking for transportation, work, leisure and exercise. Panel members selected nine factors, two that reflect person-level participation in walking and seven that reflect community characteristics that influence walking behavior.
Definition of the Factors. To guide subsequent research and decision-making, the Panel developed a formal definition of each factor. Members drafted, reviewed, and revised the definitions and the full Panel approved the final definitions.
Identification of Data Sources. For each of the nine factors, a Panel member led the process of identifying possible data sources for evaluating that factor. The Panel then discussed the identified data sources and selected the most appropriate source for each factor.
Specification of Indicators. After considering the definition of each factor and the data sources, members identified a specific indicator for each factor. They then used the indicators to evaluate the status of each factor in the U.S.
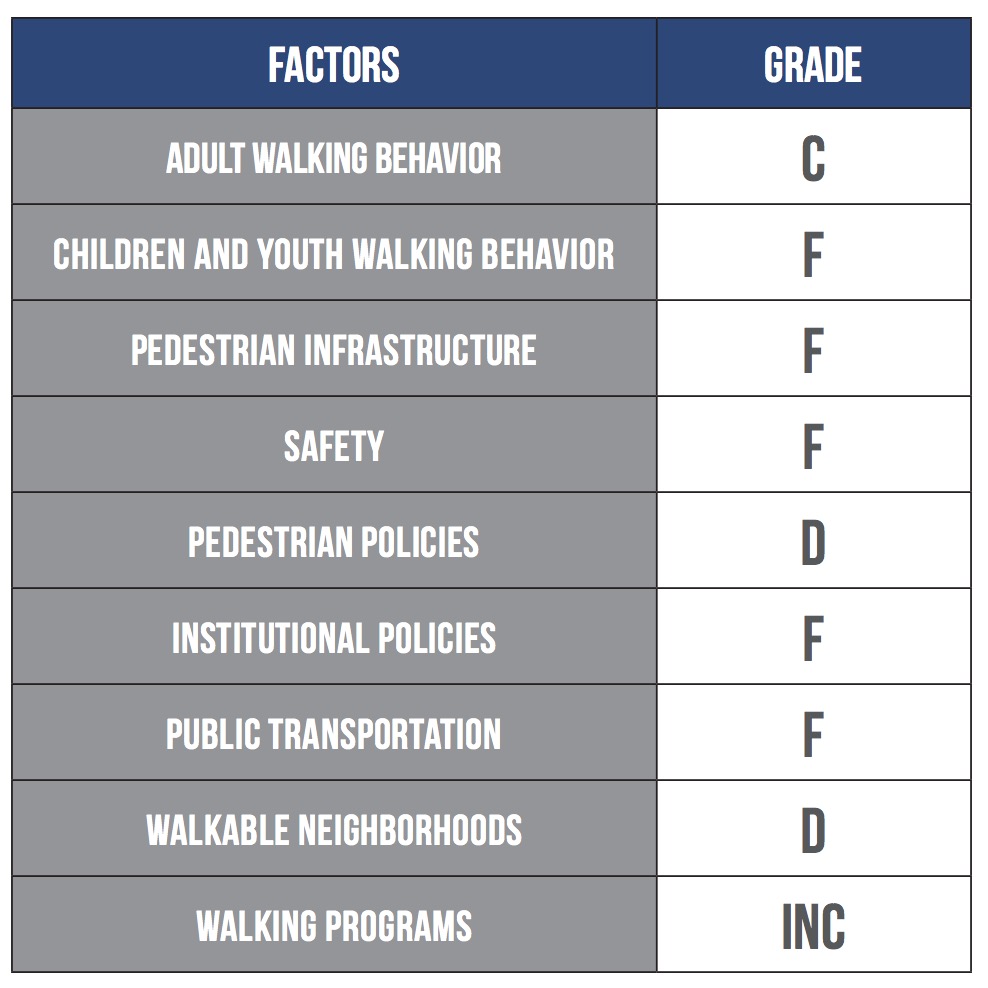
Adoption of a Grading System. The Panel adopted an A to F grading system based on either the percentage of persons in the U.S. who engaged in a specified walking behavior or the percentage of states that met a standard for community-level factors. The grading rubric is summarized in the table below.
Assignment of Grades to Factors. The Panel then assigned a grade to each factor, using the grading system.
Report Card Grading Rubric:
Walking Report Card: Walking Behavior, Walkability and Transit
Adult Walking Behavior
Definition: Adults in all demographic subgroups report walking on a regular basis for transportation, work, recreation, and/or planned exercise.
Indicator: Percent of adults who report walking for transportation or leisure in at least one bout of 10 minutes or more in the preceding 7 days
Surveillance System: National Health Interview Survey 2015, Cancer Control Supplement
Percent Compliance: 63.9%
Grade and Rationale: The United States receives a grade of C because slightly more than half of adults report walking for transportation or leisure.
Walking is a multipurpose activity that provides many opportunities for adults to incorporate physical activity for exercise, leisure, and transportation into their busy lives. Walking is generally an accessible and inexpensive activity and has a lower risk of injury than vigorous-intensity activities. Walking also may be a simple way to help people who are inactive become physically active because walking can be easily adapted to fit their needs and abilities. As a result, promotion of walking is an essential strategy to help adults meet physical activity guidelines and to enhance overall public health.
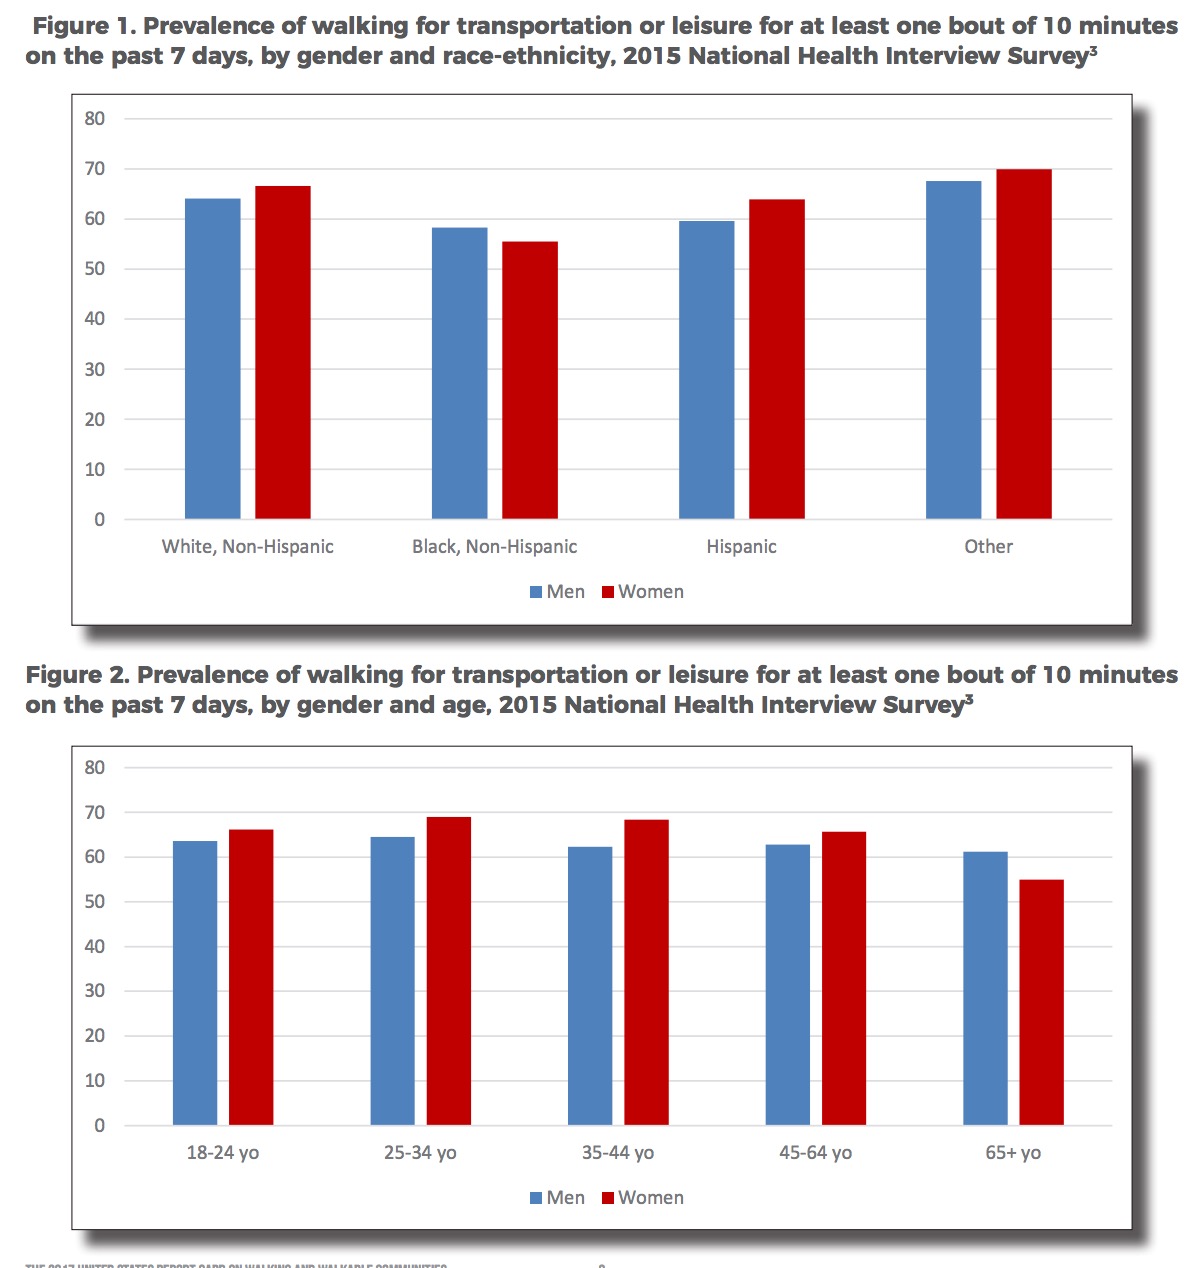
The United States receives a C because 63.9% of adults reported walking for transportation or leisure in at least one bout of 10 minutes or more in the preceding 7 days. The prevalence of walking for transportation or leisure was higher among women (65.1%) than men (62.8%). Although the overall prevalence of adult walking behavior increased significantly from 2005 to 2015, there has been little improvement from 2010 to 2015. However, among women, there was a significant increase (2.6 percentage points) in the prevalence of walking from 2010 to 2015.
Limitations of the data source: Prevalence of physical activity and compliance with current physical activity guidelines among adults in the United States are measured through a variety of federally administered surveillance systems. All of them rely on respondent self-report and are subject to the inaccuracies associated with this type of data collection method. In addition to NHIS, four other surveillance systems measure walking behavior: the American Community Survey (ACS), the American Time Use Survey (ATUS), the National Household Travel Survey (NHTS) and the Behavioral Risk Factor Surveillance System (BRFSS). Each surveillance system varies with respect to the frequency and format of the questions. For example, ACS measures mode of transportation to work, ATUS is a daily log of activities, and NHTS assesses walking for travel. Although the BRFSS collects data at the state level, it does not ask respondents specifically about walking behavior. Rather, it asks respondents to report the two most frequent physical activities, with walking being an option. This is different than asking respondents about their walking behavior. Periodically, BRFSS has inquired about walking behaviors in subsets of the population such as people with arthritis.⁹ State-specific data on walking for transportation and leisure is needed to assess this important behavior.
Another limitation is the inability of these data sources to reflect the evolving definition of “walking” that is more inclusive of individuals with disabilities who rely on wheelchairs or other mobility aids. Questions posed on future national surveys should be framed to account for, and encourage, physical activity comparable to walking in able-bodied individuals.
…
Walkable Neighborhoods – D
Definition: Neighborhoods are designed to support walking for transportation, work, recreation, and planned exercise.
Indicator: Percent of states with at least 30% of the population living in highly walkable neighborhoods
Surveillance System: U.S. Environmental Protection Agency
Percent Compliance: 32%
Grade and Rationale: The United States receives a grade of D because only 32% of states (n = 16) meet the standard of ≥ 30% of residents living in a highly walkable neighborhood.
Neighborhoods with sidewalks, transit stops, and destinations, such as parks, stores, and places of employment that encourage walking and biking can be described as walkable communities. Walkable neighborhoods support walking for leisure and utilitarian purposes among people of all ages. Because walking is an easy and convenient form of physical activity, it can help people meet physical activity guidelines.1 Therefore, enhancing walkability promotes public health goals, and creating walkable communities should be a high priority for public policymakers.
Walkability scores for all census block groups in all 50 states were calculated using publically available data from the US Environmental Protection Agency’s Smart Location Mapping database. Population density, employment and household entropy, and street intersection density were extracted and used to create a standardized measure of walkability for census blocks using the formula: population density + entropy index + intersection density/3. Walkability scores were divided into quartiles, and the top 25% of census block groups were designated as “highly walkable areas.” Population data used for the calculation are from the 2010 decennial census at the block group level.
Currently, scientific literature does not provide evidence-based standards for neighborhood walkability. Neither do studies indicate the level of walkability needed to support positive health outcomes. Because there are multiple ways to compute walkability scores, with different variables involved, the lack of set thresholds for walkability standards is not surprising.
For this Report Card on Walking and Walkability, the standard for walkability was set at 30% or more of residents living in a highly walkable neighborhood. A 30% standard provides states with an achievable benchmark to guide environmental and policy changes. Currently, only 16 out of 50 states (or 32%) meet the standard, which is equivalent to a grade of D. States that meet the standard are Arizona, California, Colorado, Florida, Illinois, Massachusetts, Nebraska, Nevada, New Jersey,
New York, North Dakota, Oregon, Pennsylvania, Rhode Island, Utah, and Washington. Twenty-two states are close to meeting the standard, with 20-29% of their population living in highly walkable areas. In order for the US to reach a grade of C, 25 states (an additional 9 states) must reach the standard of 30% or more population of their population living in highly walkable areas.
Limitations of the data source: A strength of the data used to assess walkability is that it includes information on all census tracts in all states. However, the data do not capture subjective measures of neighborhood environment, primarily perceived safety, greenness (e.g., street trees) and aesthetics. Such measures will be available in future surveillance systems. For example, the EnviroAtlas, under development by the US EPA will contain metrics specifically related to green space and health, such as estimated walking distance to a park entrance, percent of residential population within 500m of a park, estimated percent tree cover within 26m of a road edge, and tree canopy/green space along walkable roads. Additional information on EnviroAtlas is available at https://www.epa.gov/enviroatlas.
Download full version (PDF): The 2017 United States Report Card on Walking and Walkable Communities
About the National Physical Activity Plan Alliance
www.physicalactivityplan.org
The National Physical Activity Plan Alliance (NPAPA) is a non-profit organization that is committed to insuring the long term success of the National Physical Activity Plan (NPAP). The Alliance is a coalition of national organizations that have come together to insure that efforts to promote physical activity in the American population will be guided by a comprehensive, evidence-based strategic plan. The Alliance is governed by a Board of Directors that is composed of representatives of organizational partners and at-large experts on physical activity and public health.
Tags: Activity, BRFSS, National Physical Activity Plan, National Physical Activity Plan Alliance, Sports, Walkability, Walking


 RSS Feed