TEXAS TRANSPORTATION INSTITUTE
EXECUTIVE SUMMARY
Congestion is a significant problem in America’s urban areas. This is well documented in the Texas Transportation Institute’s Urban Mobility Report. Powered by 2010 INRIX traffic data, the 2011 Congested Corridors Report includes analysis along 328 specific (directional) freeway corridors in the United States. These corridors include many of the worst places for congestion in the United States, and the detailed data allow for more extensive analysis and a better picture of the locations, times and effects of stop-and-go traffic. The report doesn’t list every bad location for congestion, but the issues explored here advance the understanding of when, how and where congestion occurs.
WHAT DID WE FIND?
The 328 directional corridors account for:
• 6 percent of the national urban freeway lane-miles
• 36 percent of the urban freeway delay with only 10 percent of the national urban freeway vehicle-miles of travel
• 33 percent of the urban freeway truck delay with only 8 percent of the national urban freeway truck vehicle-miles of travel
These roads have more stop-and-go traffic than others, but perhaps more frustrating, it is also difficult to predict how much time the trips will take. For important trips, this forces motorists and truckers to plan much more time to ensure they will not be late.
…
TRAVEL TIME RELIABILITY CONCEPTS AND MEASURES
“I’ve got to get to work on time today or Mr. NoLeeway will surely fire me!” “If this delivery is late, the assembly line will shut down!” “If I don’t get to the daycare by 5:30 to pick up Zach, Ms. Timely will make me pay extra again!” “I can’t miss the start of my daughter’s soccer game!”
Any of these sound familiar? We’ve all made urgent trips. Motorists and truckers make them every day. For trips that are not urgent, you have an expectation of how long it will take you to get there. On your daily commute trips, this is the average time it takes you based on your past experiences. For more urgent trips, you will add extra time to your average trip time to ensure you get there on time. That extra time “buffer” is what reliability performance measures are designed to help us understand.
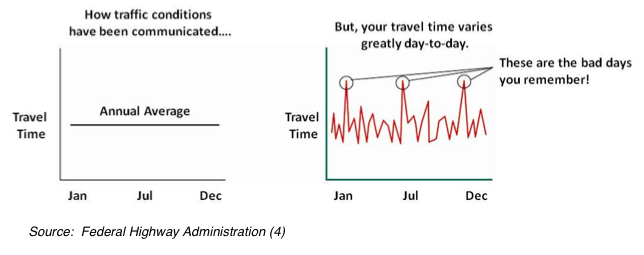
As shown in the graphic below, your travel time can vary greatly from day to day. The “bad days” (very unreliable) are the ones you will remember. That’s the day there was a crash, several stalled vehicles, a snowstorm, or construction that made the trip take much longer. When you have an urgent trip, you will use these “bad days” to help you estimate the extra buffer time you need to guarantee you get there on time.
Download Full Report (PDF): 2011 Congested Corridors Report
About Texas Transportation Institute
http://tti.tamu.edu
“The Texas Transportation Institute (TTI), a member of The Texas A&M University System, seeks solutions to the problems and challenges facing all modes of transportation. TTI, which celebrated its 60th anniversary in 2010, works on over 600 research projects with over 200 sponsors annually at all levels of government and the private sector. TTI is recognized as one of the finest higher education-affiliated transportation research agencies in the nation and helps prepare students for transportation careers.”
Tags: Congestion, Roads, Texas A&M, Texas Transportation Institute


 RSS Feed