NEW YORK CITY DEPARTMENT OF TRANSPORTATION
Executive Summary
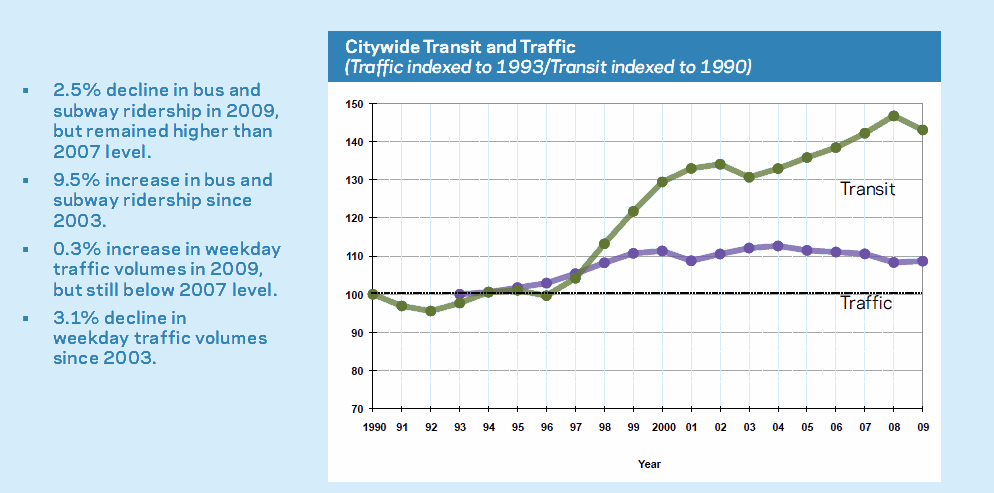
Traffic and transit indicators were significantly affected by the economic recession and resumption of job growth that occurred in New York City over the past two-plus years. Initially, transit ridership fell sharply due to job losses, budget cuts and increased fares, while traffic levels edged upward. As the city’s economy began to emerge from the recession in 2010, however, subway (though not bus) ridership began to increase while traffic levels flattened out. The key trends, based on comprehensive data available for 2009 and the more limited data available for 2010, are:
- Subway and bus ridership fell 2.5% citywide from 2008 to 2009. The declines were more severe for transit ridership into the Manhattan Central Business District (CBD – defined as 60th Street to the Battery), which experienced more rapid job losses than did the city as a whole; CBD-bound transit ridership fell 5.7% in 2009.
- Traffic levels increased 0.3% citywide and 1.1% for traffic entering the Manhattan CBD from 2008 to 2009.
- Subway ridership began to grow in the spring of 2010 and finished with a 1.5% increase for the year as a whole, while bus ridership declined throughout 2010.
- Citywide traffic levels were not significantly changed in 2010 compared with 2009, based on traffic data from tolled bridges and tunnels and New York City Department of Transportation (DOT) traffic counts at a randomly selected sample of locations throughout the city. (Note that CBD-bound traffic and transit data are not yet available for 2010.)
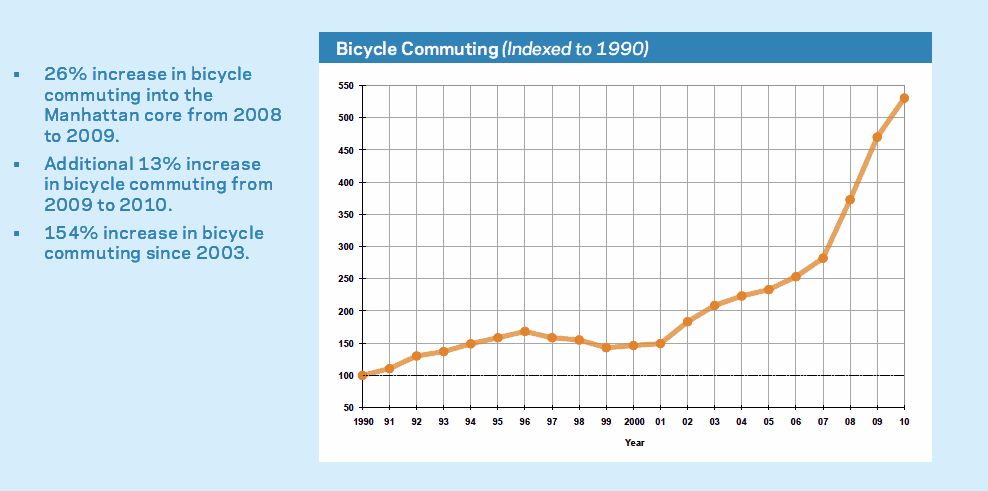
- The one consistent trend involved bike riding, which continued a pattern of rapid increases. Commuter cycling increased 26% from 2008 to 2009, and an additional 13% from 2009 to 2010.
The available data for 2010 thus suggest that New York City may be positioned to resume the trends seen during the economic expansion of the last decade. From 2003 until the 2008 recession, New York City experienced a period of fully transit-centered economic and population growth in which non-auto modes absorbed all the growth of travel in the city. Vehicle traffic levels declined slightly while subway and bus ridership rose 12% from 2003 to 2008 and commuter cycling increased 79%. These trends were consistent with the transportation and sustainability goals of encouraging mass transit, walking, cycling and ferries established in PlaNYC, the City’s sustainability plan for 2030, and Sustainable Streets, DOT’s strategic plan.
Looking beyond the recession, sustainable modes of transportation will likely absorb increased travel generated by economic and population growth – but only if the City and the Metropolitan Transit Authority (MTA) commit the resources to support these modes. The importance of investing in transit and other transportation improvements is illustrated by the two bright spots in the overall picture in the last several years. First, while the bus system as a whole was losing ridership, new Select Bus Services (SBS) in the Bronx and Manhattan attracted increased bus ridership. In a similar vein, continued expansion of the bike network spurred large increases in cycling both into the Manhattan core, and in other areas of the city.
Download full version (PDF): 2010 Sustainable Streets Index
About the New York City Department of Transportation
www.nyc.gov/html/dot
“Our mission is to provide for the safe, efficient, and environmentally responsible movement of people and goods in the City of New York and to maintain and enhance the transportation infrastructure crucial to the economic vitality and quality of life of our primary customers, City residents.”
Tags: Bicycling, Cycling, DOT, New York City, New York City Department of Transportation, NYC


 RSS Feed