SOLAR ELECTRIC POWER ASSOCIATION
Introduction
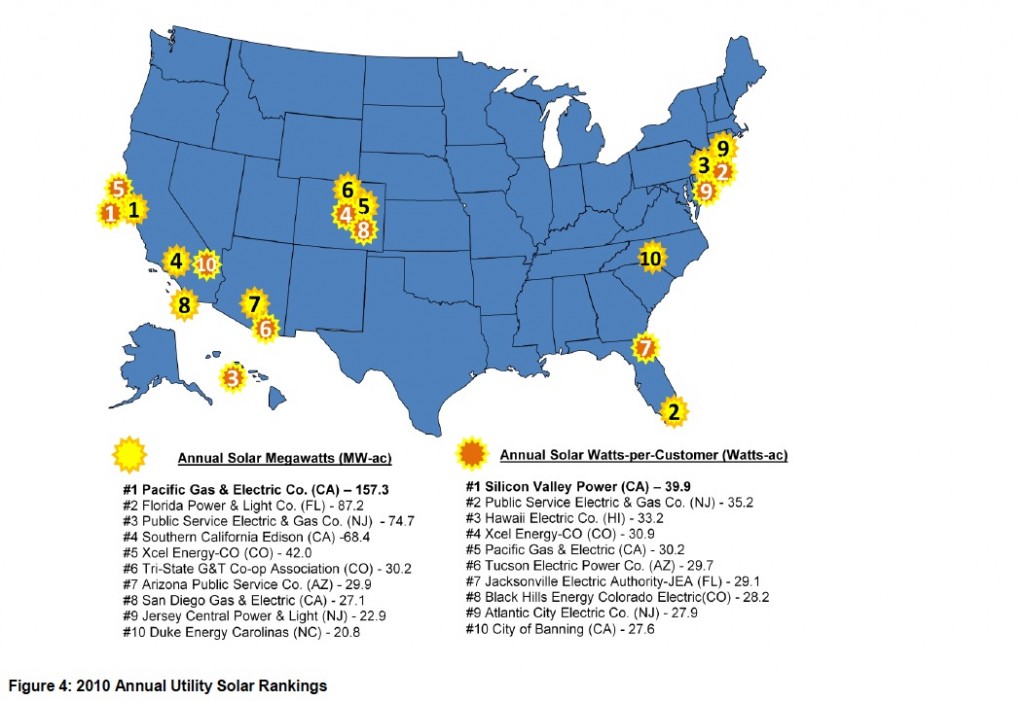
The Solar Electric Power Association‘s (SEPA) fourth annual Utility Solar Rankings report analyzes utility solar electricity markets in the United States, focusing particularly on the top utilities that are driving solar electric power growth. The SEPA Top 10 ranked utilities integrated 561 megawatts (MW) of solar electricity capacity in 2010, representing 100 percent growth over one year.
In addition to continued growth, the new report shows two dramatic changes taking place in utilities‘ use of solar power. 1) The report demonstrates that more and more growth came from areas outside the traditionally strong solar regions of California and the Southwest. Many utilities in other parts of the country now have sizeable solar portfolios, and tens of thousands of photovoltaic (PV) systems were installed in nationwide. 2) With a growing trend toward more utility-owned solar projects and third-party power purchase agreements (PPA), the industry is no longer based solely on customer-owned, net-metered systems.
Among the Report‘s key conclusions:
- Utility solar electric markets continue to expand rapidly across the country. About 63 percent of the new solar capacity came from utilities outside California in 2010, the largest percentage on record. Seven of this year‘s Top 10 Solar MW utilities were from outside of California, and four of the top-ranking utilities were located in the Eastern United States. Solar power is becoming recognized as an important element in the energy supply planning and customer energy management of utilities nationwide.
- Two new growth trends are changing the profile of solar electric power in the United States: centralized projects and utility ownership. Traditionally, solar markets have relied on distributed PV for most new capacity. However, centralized projects are gaining new traction—eight centralized projects greater than 10 MW each were installed in 2010. This included what are now the two largest PV projects in the United States—the 48 MW Copper Mountain project, in Nevada, with power purchased by Pacific Gas & Electric and the 30 MW Cimarron project, in New Mexico, purchased by Tri-State Generation & Transmission Cooperative Association. The largest concentrating solar power (CSP) project in nearly 20 years was also installed in 2010. It is a hybrid CSP-natural gas facility owned by Florida Power & Light. Centralized projects totaled 226 MW in 2010, up from two projects totaling 46 MW the year before.
Thirty utilities reported owning 140 MW of solar, as opposed to purchasing the power from facilities owned by others. This utility ownership represents a more than 300 percent increase over the previous year. Based on future announcements and plans in both categories, both trends are expected to continue their growth and market penetration. - Individual utility solar portfolios reveal very different market dynamics and procurement strategies. Utility solar portfolios differ by project technology (PV or CSP), type (distributed or centralized) and ownership (customer, third-party or utility). Some utilities are purchasing power from solar systems, such as rooftop PV, owned by their customers, while others are creating a solar electric market by procuring and/or owning large amounts of solar generation resources. Many are doing both. Like different investment portfolios varying in percentages of stocks, bonds and cash, the Top 10 utilities‘ cumulative solar portfolios reflect varying amounts of utility ownership, CSP technology and distributed PV, discussed in more detail in the full report. Solar portfolios vary from utility to utility because of different state policies, utility preferences, solar resources, electricity prices, incentives available and other factors.
This year‘s Top 10 report not only depicts a rapid rise in the amount of solar installed on utility grids, but a trend towards utility-led initiatives that is behind much of the expansion of the solar market. The remainder of the report includes discussion on the national rankings, including an analysis of the Top 10 cumulative utilities‘ solar portfolios, as well as rankings by region (west, central, and east) and utility-type (cooperative, investor-owned and municipal). Each rankings section includes detailed discussions about emerging trends in geographic diversity, project characteristics, technologies, and utility ownership.
Download full version (PDF): 2010 SEPA Utility Solar Rankings
View interactive maps and tables
About the Solar Electric Power Association
www.solarelectricpower.org
The Solar Electric Power Association (SEPA) is an educational non-profit organization dedicated to helping utilities integrate solar energy into their portfolio. From facilitating peer-to-peer interaction between utilities and the solar industry to hosting one of the industry’s leading educational forums on utility solar, SEPA is the go-to resource for unbiased utility solar information.


 RSS Feed